
SLIDE 1
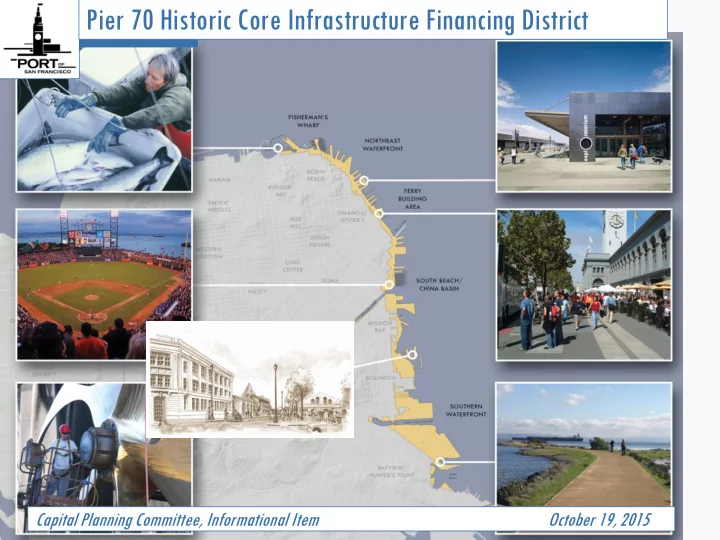
Pier 70 Historic Core Infrastructure Financing District
Capital Planning Committee, Informational Item October 19, 2015
Pier 70 Historic Core Infrastructure Financing District Capital - - PowerPoint PPT Presentation
Pier 70 Historic Core Infrastructure Financing District Capital Planning Committee, Informational Item October 19, 2015 Deficit in Sources for Capital Supporting our Adaptive Waterfront Financial Management Strategies Operating Reserve
Capital Planning Committee, Informational Item October 19, 2015
– Operating Reserve Policy: 15% operating reserve in FY2008-09; equals $11 million for FY2014-15 – Capital Designation Policy: adopted 2012 * requires revenue set aside for annual capital investment * equals 20% from FY2013-14 to FY2017-18 increases to 25% thereafter
– 10-Year Capital Plan developed 2006; $200+ million in public investment to date – Priority for investment in revenue-generating development – Targeted use of Federal sources – City GO Bonds for Parks: 2008 & 2012
–
3
Port Commission Resolution 14-33 (2014 Orton Lease Approval)
BOS Resolution 273-14 (2014 Orton Lease Approval)
8
9
10
Anticipated Uses
Dollars Target Completion Schedule Crane Cove Park - Phase 2
Based on funding avail
FY 2016/17
Street, sidewalk, traffic signal improvements
FY 2016/17 – FY 2017/18 Total
11
Crane Cove Park
MARITIME GARDENS
Living Shoreline Native Planting Relic Interpretation Park Pavilion
12
13
Improve accessibility on 20th St. Improve intersection at Louisiana St.
14
Install ADA compliant curb ramps Patch sidewalks
15
Revenue / Expenditure Lower Scenario, 2015 Dollars Higher Scenario, 2015 Dollars Gross receipts tax revenues $0 $17,343,100 Sales tax, utility users tax and property tax in-lieu of VLF 16,599,800 16,599,800 Business registration fee revenues 5,225,400 2,239,500 Revenues from other taxes and fees 2,144,200 2,144,200 Total General Fund Revenues $23,969,400 $38,326,600 Police, Fire and EMS Expenses 8,152,700 8,152,700 Total General Fund Expenses $8,152,700 $8,152,700 Net General Fund Benefit $15,816,700 $30,173,900
16
17
18