
SLIDE 1
Physics ¡428: ¡Imaging ¡Detectors ¡for ¡Medical ¡and ¡Health ¡Sciences
- Lead ¡Instructor: ¡Paul ¡Kinahan
- Lectures: ¡ ¡ ¡Tuesday ¡6:30-‑8:50 ¡PM, ¡PAA ¡Room ¡110
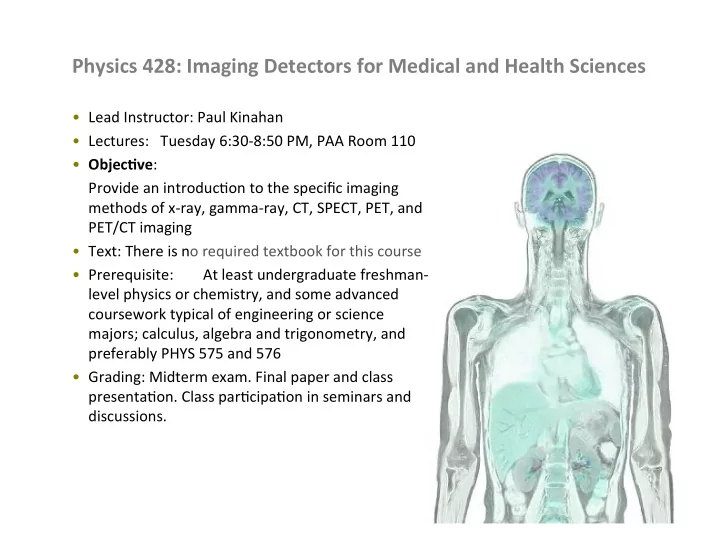
- Objec?ve:
Provide ¡an ¡introducDon ¡to ¡the ¡specific ¡imaging methods ¡of ¡x-‑ray, ¡gamma-‑ray, ¡CT, ¡SPECT, ¡PET, ¡and PET/CT ¡imaging
- Text: ¡There ¡is ¡no ¡required ¡textbook ¡for ¡this ¡course
- Prerequisite:
At ¡least ¡undergraduate ¡freshman-‑ level ¡physics ¡or ¡chemistry, ¡and ¡some ¡advanced coursework ¡typical ¡of ¡engineering ¡or ¡science majors; ¡calculus, ¡algebra ¡and ¡trigonometry, ¡and preferably ¡PHYS ¡575 ¡and ¡576
- Grading: ¡Midterm ¡exam. ¡Final ¡paper ¡and ¡class
- presentaDon. ¡Class ¡parDcipaDon ¡in ¡seminars ¡and
discussions.