
SLIDE 1
WC 2003 August 2003
Sue Edyvean, Nicholas Keat ImPACT* (Imaging Performance Assessment of CT Scanners) London UK *An MHRA Evaluation centre for the UK Department of Health (Medicines and Healthcare products Regulatory Agency) www.impactscan.org
Comparison of Definitions of Geometric Efficiency in Computed Tomography Scanners
WC 2003 August 2003
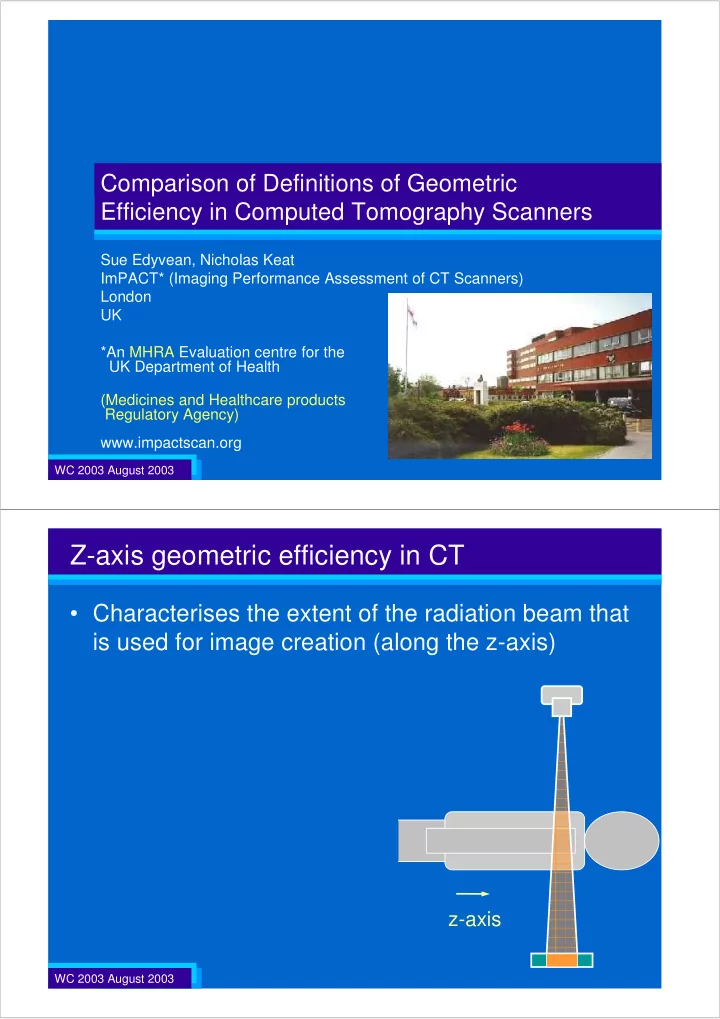
Z-axis geometric efficiency in CT
- Characterises the extent of the radiation beam that