
SLIDE 1
Our Our Place Place in in the the Cosmos Cosmos
Lecture 11 Understanding Stars - the H-R Diagram
Understanding Stars
- We saw in the last lecture that by measuring
the brightness, distance (via parallax) and spectrum of a star, we can determine the following physical properties
- Surface temperature
- Radius
- Luminosity
- Mass (for binary stars)
- Just knowing these properties does not mean
that we understand stars
H-R Diagram
- The Hertzsprung-Russell diagram (H-R diagram
for short) enables one to see patterns in the properties of stars
- It is named after Einar Hertzsprung and
Henry Norris Russell, the first astronomers to independently make plots of the luminosity of stars against their temperature or colour, around 1906-1913
- The H-R diagram allows one to track the
birth, life and death of stars
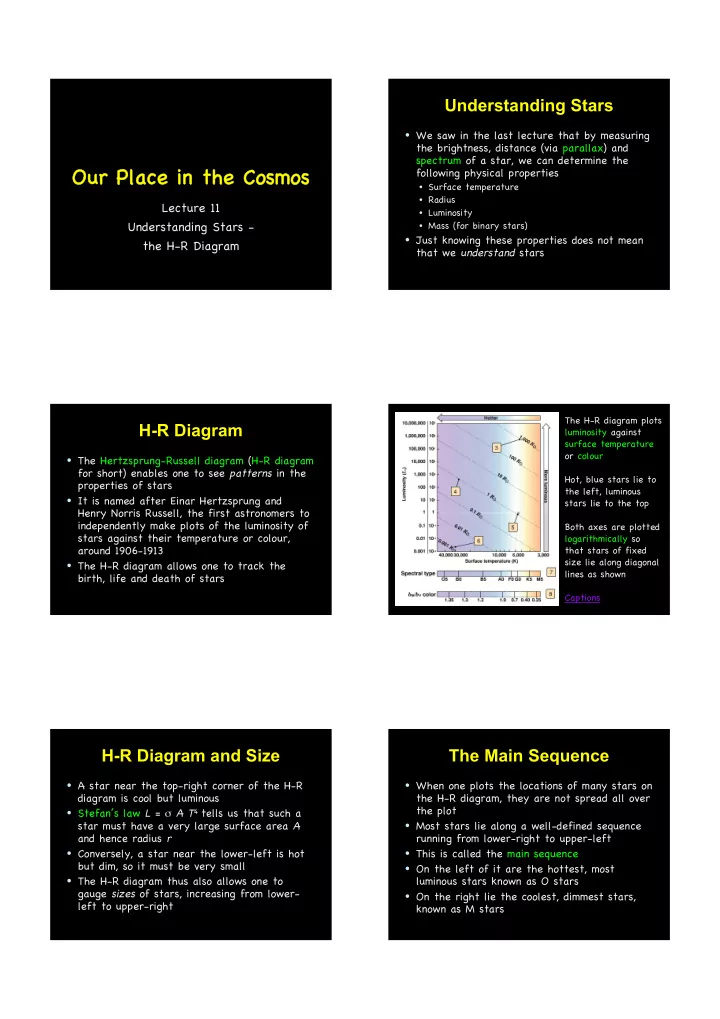
The H-R diagram plots luminosity against surface temperature
- r colour
Hot, blue stars lie to the left, luminous stars lie to the top Both axes are plotted logarithmically so that stars of fixed size lie along diagonal lines as shown Captions
H-R Diagram and Size
- A star near the top-right corner of the H-R
diagram is cool but luminous
- Stefan’s law L = A T4 tells us that such a
star must have a very large surface area A and hence radius r
- Conversely, a star near the lower-left is hot
but dim, so it must be very small
- The H-R diagram thus also allows one to
gauge sizes of stars, increasing from lower- left to upper-right
The Main Sequence
- When one plots the locations of many stars on
the H-R diagram, they are not spread all over the plot
- Most stars lie along a well-defined sequence
running from lower-right to upper-left
- This is called the main sequence
- On the left of it are the hottest, most
luminous stars known as O stars
- On the right lie the coolest, dimmest stars,