office of research administration kpi summary highlights
play

Office of Research Administration KPI Summary/Highlights Proposals - PowerPoint PPT Presentation

Office of Research Administration KPI Summary/Highlights Proposals FYTD July 2017 Proposal Statistics by School Fiscal Year 2017 SAB 2015 2016 2017 School % change 2015 vs 2016 % change 2016 vs 2017 Total Proposal Proposed (#) Total


  1. Office of Research Administration KPI Summary/Highlights 
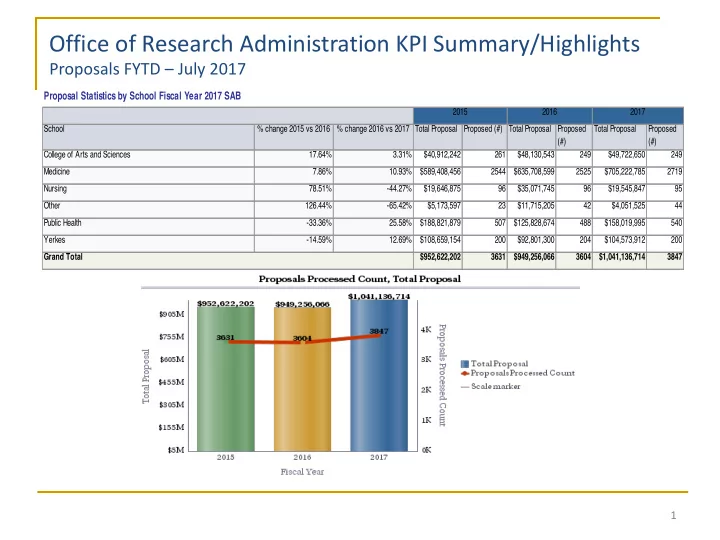
Proposals FYTD – July 2017 Proposal Statistics by School Fiscal Year 2017 SAB 2015 2016 2017 School % change 2015 vs 2016 % change 2016 vs 2017 Total Proposal Proposed (#) Total Proposal Proposed Total Proposal Proposed (#) (#) College of Arts and Sciences 17.64% 3.31% $40,912,242 261 $48,130,543 249 $49,722,650 249 Medicine 7.86% 10.93% $589,408,456 2544 $635,708,599 2525 $705,222,785 2719 Nursing 78.51% -44.27% $19,646,875 96 $35,071,745 96 $19,545,847 95 Other 126.44% -65.42% $5,173,597 23 $11,715,205 42 $4,051,525 44 Public Health -33.36% 25.58% $188,821,879 507 $125,828,674 488 $158,019,995 540 Yerkes -14.59% 12.69% $108,659,154 200 $92,801,300 204 $104,573,912 200 Grand Total $952,622,202 3631 $949,256,066 3604 $1,041,136,714 3847 1

  2. Office of Research Administration KPI Summary/Highlights Awards FYTD – July 2017 2015 2016 2017 School % Variance % Variance Aw ard ($) Aw ard (#) Aw ard ($) Aw ard (#) Aw ard ($) Aw ard (#) 2015 vs 2016 2016 vs 2017($) College of Arts and Sciences -12% 28% 25,166,410 130 22,172,204 119 28,320,051 149 Medicine -14% 13% 300,335,736 1902 258,269,078 1800 291,300,888 2078 Nursing 0% 3% 12,428,441 69 12,438,676 67 12,859,939 67 Other -1% 7% 7,246,220 41 7,201,523 40 7,705,034 46 Public Health 8% 45% 73,054,762 284 78,670,823 313 113,851,415 324 Yerkes 52% -11% 42,700,189 96 65,082,228 108 58,130,374 130 Grand Total 460,931,759 2522 443,834,532 2447 512,167,701 2794 2

  3. Office of Research Administration KPI Summary/Highlights Expenditures FYTD – July 2017 Expenses 3-Year Variance By Operating Unit Expenditures PPY to PY PY to CY 2015 2016 2017 Variance Variance College or Arts and Sciences 9.09% 1.18% 25,476,056 27,792,879 28,120,305 Medicine 3.85% 6.82% 265,494,591 275,711,404 294,519,796 Nursing 19.83% (7.30%) 9,589,463 11,490,969 10,652,224 Other (1.98%) 10.81% 8,097,042 7,936,327 8,794,515 Public Health 19.97% 17.96% 58,903,195 70,666,834 83,356,068 Yerkes (2.26%) 15.23% 62,491,047 61,079,047 70,383,464 Grand Total 430,051,395 454,677,461 495,826,372 FY2017 Expenditures as of 7/31/2017 3

  4. Office of Sponsored Programs Award Setup Processing Time, July 2017

  5. OSP & OTT KPI Summary/Highlights – July 2017 Average Contracts Negotiation Processing Time • PHASE 1: PHASE 2: PHASE 3: Total Time: Received by Received by Contract First Revision To Negotiations Contract Group To Fully Agreement Type Group Negotiations Completed To Fully Executed To First Revision Completed Executed Industry CTAs 12 (7) 48 (32.5) 4 (2) 96 (85) non-Industry CTAs** 5 (4) 18 (5) 10 (12) 76 (47) Industry Research Agreements 9 (9.5) 31 (31) 4 (5) 74 (81) non-Industry Research Agreements 4 (3) 3 (1) 8 (9) 20 (15) *Median in Parenthesis Research Services Agreements 7 (7.5) 13 (9) 18 (18) 22 (22) Confidentiality Agreements 3 (4) 9 (5) 4 (3) 25 (22) Amendments 4 (2) 9 (1) 7 (6) 19 (10) Other 9 (7) 21 (1) 9 (5) 40 (22) *Median in parenthesis 5

  6. OTT KPI Summary/Highlights – July 2017 Clinical Trials Turnaround 120 Median Days 100 80 60 40 20 0 Phase 1 Phase 2 Phase 3 Total Time 6

Download Presentation
Download Policy: The content available on the website is offered to you 'AS IS' for your personal information and use only. It cannot be commercialized, licensed, or distributed on other websites without prior consent from the author. To download a presentation, simply click this link. If you encounter any difficulties during the download process, it's possible that the publisher has removed the file from their server.

Recommend


More recommend