
SLIDE 1
Office of Research Administration KPI Summary/Highlights
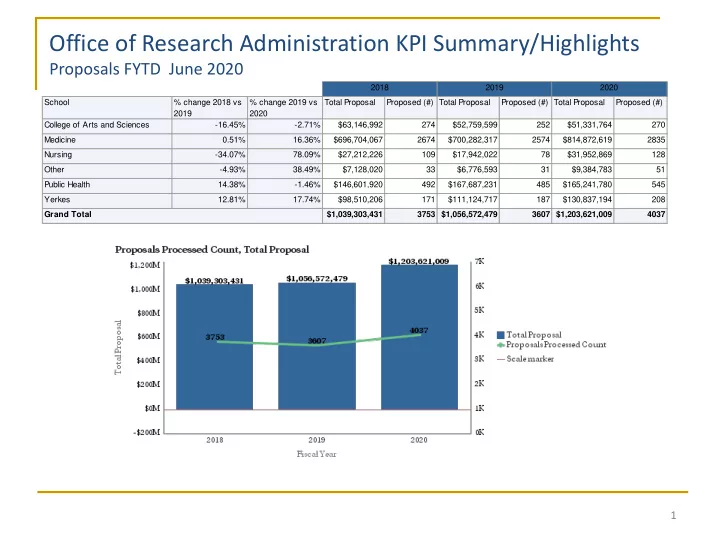
Proposals FYTD June 2020
1
School % change 2018 vs 2019 % change 2019 vs 2020 Total Proposal Proposed (#) Total Proposal Proposed (#) Total Proposal Proposed (#) College of Arts and Sciences
- 16.45%
- 2.71%
$63,146,992 274 $52,759,599 252 $51,331,764 270 Medicine 0.51% 16.36% $696,704,067 2674 $700,282,317 2574 $814,872,619 2835 Nursing
- 34.07%
78.09% $27,212,226 109 $17,942,022 78 $31,952,869 128 Other
- 4.93%
38.49% $7,128,020 33 $6,776,593 31 $9,384,783 51 Public Health 14.38%
- 1.46%
$146,601,920 492 $167,687,231 485 $165,241,780 545 Yerkes 12.81% 17.74% $98,510,206 171 $111,124,717 187 $130,837,194 208 $1,039,303,431 3753 $1,056,572,479 3607 $1,203,621,009 4037 2018 2019 2020 Grand Total