
SLIDE 1
Office of Research Administration KPI Summary/Highlights
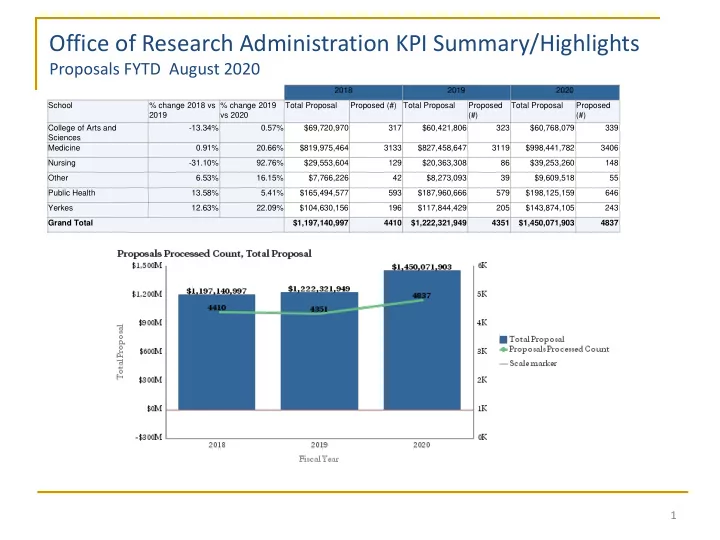
Proposals FYTD August 2020
1
2018 2019 2020 School % change 2018 vs 2019 % change 2019 vs 2020 Total Proposal Proposed (#) Total Proposal Proposed (#) Total Proposal Proposed (#) College of Arts and Sciences
- 13.34%
0.57% $69,720,970 317 $60,421,806 323 $60,768,079 339 Medicine 0.91% 20.66% $819,975,464 3133 $827,458,647 3119 $998,441,782 3406 Nursing
- 31.10%
92.76% $29,553,604 129 $20,363,308 86 $39,253,260 148 Other 6.53% 16.15% $7,766,226 42 $8,273,093 39 $9,609,518 55 Public Health 13.58% 5.41% $165,494,577 593 $187,960,666 579 $198,125,159 646 Yerkes 12.63% 22.09% $104,630,156 196 $117,844,429 205 $143,874,105 243 Grand Total $1,197,140,997 4410 $1,222,321,949 4351 $1,450,071,903 4837