Office of Research Administration KPI Summary/Highlights Proposals - - PowerPoint PPT Presentation

office of research administration kpi summary highlights
SMART_READER_LITE
LIVE PREVIEW

Office of Research Administration KPI Summary/Highlights Proposals - - PowerPoint PPT Presentation

Office of Research Administration KPI Summary/Highlights Proposals FYTD November 2019 2018 2019 2020 School % change 2018 vs % change 2019 vs Total Proposal Proposed (#) Total Proposal Proposed Total Proposal Proposed 2019 2020


slide-1
SLIDE 1

Office of Research Administration KPI Summary/Highlights

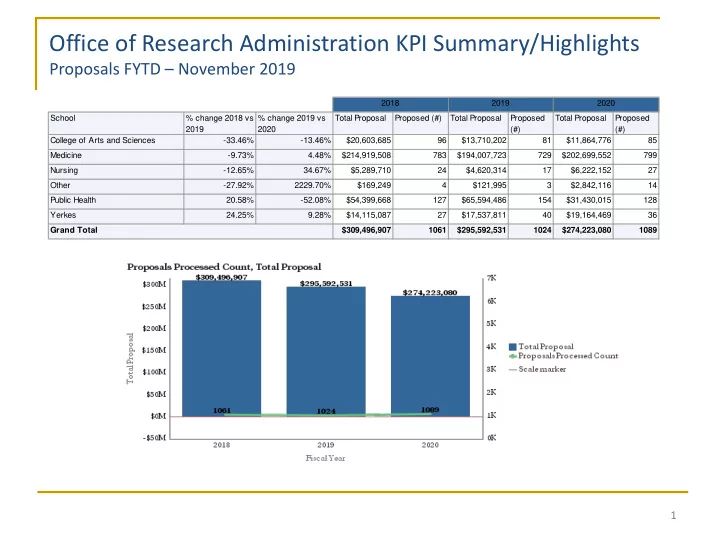
Proposals FYTD – November 2019

1

School % change 2018 vs 2019 % change 2019 vs 2020 Total Proposal Proposed (#) Total Proposal Proposed (#) Total Proposal Proposed (#) College of Arts and Sciences

  • 33.46%
  • 13.46%

$20,603,685 96 $13,710,202 81 $11,864,776 85 Medicine

  • 9.73%

4.48% $214,919,508 783 $194,007,723 729 $202,699,552 799 Nursing

  • 12.65%

34.67% $5,289,710 24 $4,620,314 17 $6,222,152 27 Other

  • 27.92%

2229.70% $169,249 4 $121,995 3 $2,842,116 14 Public Health 20.58%

  • 52.08%

$54,399,668 127 $65,594,486 154 $31,430,015 128 Yerkes 24.25% 9.28% $14,115,087 27 $17,537,811 40 $19,164,469 36 $309,496,907 1061 $295,592,531 1024 $274,223,080 1089 2018 2019 2020 Grand Total

slide-2
SLIDE 2

Office of Research Administration KPI Summary/Highlights

Awards FYTD – November 2019

2

School % Variance 2018 vs 2019($) % Variance 2019 vs 2020($) Aw ard ($) Aw ard (#) Aw ard ($) Aw ard (#) Aw ard ($) Aw ard (#) College of Arts and Sciences

  • 15.13%
  • 56.12%

7,862,637 30 6,673,049 34 2,927,995 33 Medicine

  • 19.59%

11.69% 109,666,748 569 88,182,650 579 98,488,556 605 Nursing

  • 42.60%

60.25% 3,169,743 15 1,819,424 11 2,915,627 16 Other 36.72%

  • 32.33%

589,372 9 805,767 13 545,229 11 Public Health

  • 53.91%

52.52% 33,486,421 97 15,434,333 97 23,540,072 86 Yerkes 11.25% 54.36% 5,496,238 26 6,114,447 24 9,438,014 22 160,271,158 746 119,029,670 758 137,855,493 773 Grand Total 2018 2019 2020

slide-3
SLIDE 3

Office of Research Administration KPI Summary/Highlights

Expenditures FYTD – November 2019

3

FY2020 Expenditures as of 11/30/2019 * As of 12.09.2019

PPY to PY V i PY to CY Variance 2018 2019 2020 College or Arts and Sciences 6.01% 1.57% 7,399,506 7,844,015 7,967,089 Medicine 6.48% 9.86% 82,784,743 88,147,798 96,836,805 Nursing (19.48%) 24.35% 3,121,486 2,513,508 3,125,600 Other 24.73% (28.85%) 2,305,233 2,875,331 2,045,738 Public Health 4.30% 12.42% 25,799,600 26,908,879 30,251,712 Yerkes (16.38%) 5.48% 17,938,963 14,999,729 15,821,152 139,349,531 143,289,261 156,048,095 Expenditures Grand Total

Expenses 3-Year Variance By Operating Unit

slide-4
SLIDE 4

OSP & OTT KPI Summary/Highlights – November 2019

  • Average Contracts Negotiation Processing Time

*Median in Parenthesis

4

Agreement Type PHASE 1: Received by Contract Group To First Revision PHASE 2: First Revision To Negotiations Completed PHASE 3: Negotiations Completed To Fully Executed Total Time: Received by Contract Group To Fully Executed Industry CTAs 8 (9.5) 28 (12) 55 (33) 92 (84) non-Industry CTAs** 15 (13.5) 15 (14) 24 (31) 46 (57) Industry Research Agreements 5 (5) 32 (20) 14 (8) 79 (57) non-Industry Research Agreements 3 (2) 12 (2) 13 (3) 23 (8) Research Services Agreements 14 (14.5)

  • (-)
  • (-)
  • (-)

Confidentiality Agreements 1 (1) 4 (2) 5 (3) 9 (6.5) Amendments 2 (1) 3 (1) 15 (8.5) 22 (17) Other 7 (3.5) 20 (10.5) 14 (11) 48 (27)

*Median in parenthesis

slide-5
SLIDE 5

OTT KPI Summary/Highlights – November 2019

Average Contracts Negotiation Processing Time

5

slide-6
SLIDE 6

Industry Contracts

Turnaround Targets vs Actual November 2019

Agreement Type PHASE 1: Received by ICG to 1st Revision PHASE 2: 1st Revision to Negotiation Complete PHASE 3: Negotiation Complete to Fully Executed* Total Time For All Steps Target Actual Target Actual Target Actual Target Actual Industry CTAs 8 9.5 20 12 5 2 30 23.5 Industry Research Agmt. 10 8 20 23 5 3 30 34 Research Services Agmt. 10 27 20

  • 5
  • 30
  • Confidentiality

Agmt. 4 1 8 2 5 2 19 5 Amendments 4 1 5 1 5 3 14 5 Other 10 17.5 5 40 5 5 15 62.5

OTT-ICG: Median Contract Processing Times in Business Days

* Calculated from the date the partially-executed agreement is sent to sponsor until the fully-executed agreement is received back from sponsor.