
SLIDE 1
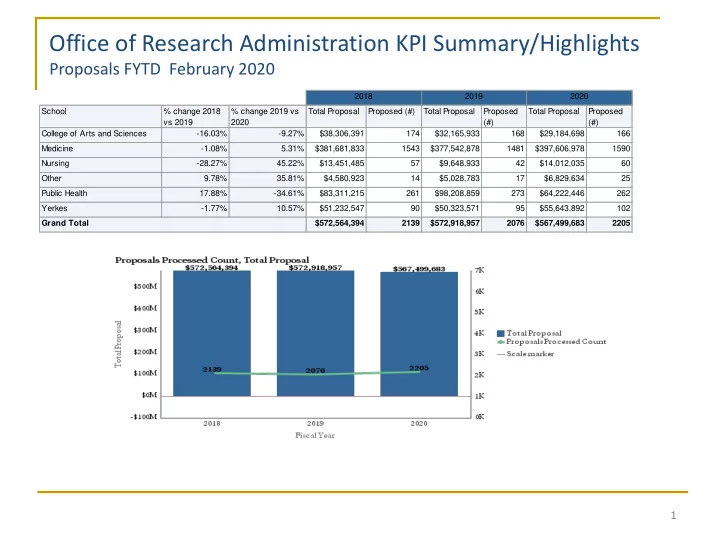
Office of Research Administration KPI Summary/Highlights
Proposals FYTD February 2020
1
School % change 2018 vs 2019 % change 2019 vs 2020 Total Proposal Proposed (#) Total Proposal Proposed (#) Total Proposal Proposed (#) College of Arts and Sciences
- 16.03%
- 9.27%
$38,306,391 174 $32,165,933 168 $29,184,698 166 Medicine
- 1.08%
5.31% $381,681,833 1543 $377,542,878 1481 $397,606,978 1590 Nursing
- 28.27%
45.22% $13,451,485 57 $9,648,933 42 $14,012,035 60 Other 9.78% 35.81% $4,580,923 14 $5,028,783 17 $6,829,634 25 Public Health 17.88%
- 34.61%
$83,311,215 261 $98,208,859 273 $64,222,446 262 Yerkes
- 1.77%
10.57% $51,232,547 90 $50,323,571 95 $55,643,892 102 $572,564,394 2139 $572,918,957 2076 $567,499,683 2205 2018 2019 2020 Grand Total