
SLIDE 1
New Economy Old Economy 7000 6000 5000 Million tce 4000 Uptake - - PowerPoint PPT Presentation
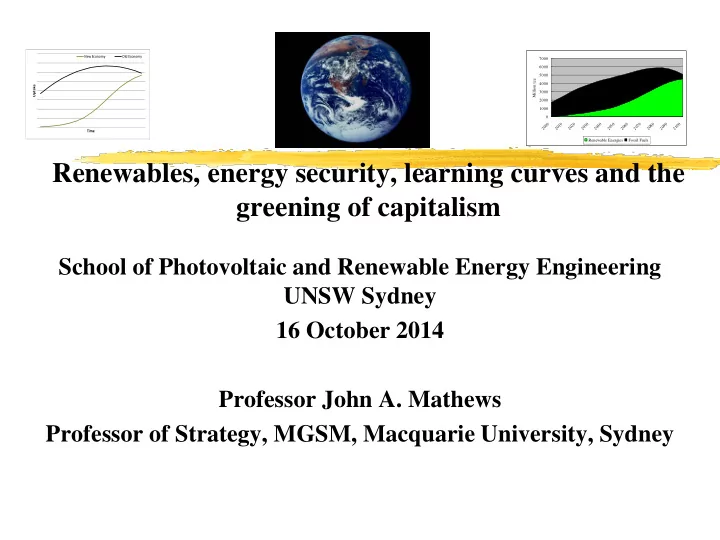
New Economy Old Economy 7000 6000 5000 Million tce 4000 Uptake 3000 2000 1000 0 2000 2010 2020 2030 2040 2050 2060 2070 2080 2090 2100 Time Renewable Energies Fossil Fuels Renewables, energy security, learning curves and
A view of the Industrial Revolution as escape from the ‘Malthusian trap’ Agrarian economy: as income rises, so does population Industrial economy: can sustain endless rises in per capita income So long as resource barriers are not infringed Fortuitous role of fossil fuels: Created a ‘subterranean forest’ (Sieferle)
5
ASIAN CONVERGENCE (relative to US GDP per head, at PPP)
1.0% 10.0% 100.0%
1 9 5 1 9 5 3 1 9 5 6 1 9 5 9 1 9 6 2 1 9 6 5 1 9 6 8 1 9 7 1 1 9 7 4 1 9 7 7 1 9 8 1 9 8 3 1 9 8 6 1 9 8 9 1 9 9 2 1 9 9 5 1 9 9 8 2 1 2 4 2 7
China India Japan South Korea
Source: Mathews & Tan; primary data: US EIA, China Electricity Council
500 1000 1500 2000 2500 3000 3500 4000 4500 500 1000 1500 2000 2500 3000 3500 4000 1980 1982 1984 1986 1988 1990 1992 1994 1996 1998 2000 2002 2004 2006 2008 2010 2012 TWh Million Tons Conventional Thermal Electricity Generation (Right Axis) Total Coal Consumption (Left Axis) Coal for Thermal Power (Left Axis)
Mathews & Tan: Source of primary data: US EIA; World Wind Energy Report
10000 20000 30000 40000 50000 60000 70000 80000 20000 40000 60000 80000 100000 120000 140000 160000 1990 1991 1992 1993 1994 1995 1996 1997 1998 1999 2000 2001 2002 2003 2004 2005 2006 2007 2008 2009 2010 2011 2012 2013 MW Million kWh Wind Electricity Generation (Left Axis) Wind Elctricity Installed Capacity (Right Axis)
Can China (and then India) scale an industrial production system that will lift not just 1 billion people out of poverty, but 5-6 billion? What would be the implications of China following a BAU pathway – using coal,
Can the ‘western’ industrial model scale in this way? Answer: No But can an alternative be built, and in time? Can China go beyond building the largest renewable energy system on the planet? Or will ‘carbon lock-in’ doom us all? Can carbon taxes and carbon markets make a sufficiently strong difference? Can corporate and social responsibility save the system? How can state intervention drive the transition? Big questions, big issues Need ‘big’ social science research, to illuminate the ‘next’ Great Transformation’ First question: Is the fossil fuel era coming to an end? How can China (and India) gain energy security?
50 100 150 200 250 300 350 400 450 500 Production of Crude Oil (mn tonnes of oil equivalent) Consumption of Crude Oil (mn tonnes)
Net Imports Net Imp
20 40 60 80 100 120 140 160 180 Production of Crude Oil (mn tonnes of oil equivalent) Consumption of Crude Oil (mn tonnes)
Net Impo rts
October 9, 2013
The new gas guzzler
By Ed Crooks and Lucy Hornby
China has overtaken the US as the world’s top oil importer. Therefore – China most vulnerable to rise and fall of oil prices … Energy security counts as most important issue in China
Source: IEA 2009
The IEA’s 2009 report shows that China and India will continue to expand their oil consumption, but OECD countries are tailing off
Grand Isle Gulf of Mexico 15m, 1947 West Delta Gulf of Mexico 28m, 1963 Hondo California 259m, 1983 Lena Gulf of Mexico 304m, 1983 Harmony California 365m, 1989 Zinc California 451m, 1993
Hoover/Diana Gulf of Mexico 1463m, 2000 Kizomba A- Angola 1219m, 2004 Mica Gulf of Mexico 1325m, 2001
Source: NASA. Picture taken by Apollo crew, December 7, 1972
Bagasse & slag 120 kt of sugar
10 kt of alcohol
330 kt of cement Sugarcane Electricity Sugar refinery Cement mill Ethanol plant Fertilizer plant Pulp mill Thermo- electricity system
Agricultural Eco-Farm
85 kt of paper 30 kt of fertilizer Alcohol residual Used molasses White sludge Alkali recovery Bagasse Paper plant Fibre- board Filter sludge limestone Source: Based on Fang et al. (2007), Lowe (2001) and Zhu & Côté (2004)
Selected industrial symbioses in Guitang Group, Guigang City, China
China: 378 GW
Bio-power (GW) Hydropower (GW) Solar PV (GW) Concentrating solar power (CSP) (GW) Wind power (GW)
US: 172 GW
Bio-power (GW) Hydropower (GW) Solar PV (GW) Concentrating solar power (CSP) (GW) Wind power (GW)
Germany: 84 GW
Bio-power (GW) Hydropower (GW) Solar PV (GW) Concentrating solar power (CSP) (GW) Wind power (GW)
India: 71 GW
Bio-power (GW) Hydropower (GW) Solar PV (GW) Concentrating solar power (CSP) (GW) Wind power (GW) 100 200 300 400 500 600 700 500 1000 1500 2000 2500 3000 3500 GW Twh Electricity From Fossil Fuels (GW) Electricity from Renewables (GW) Electricity From Fossil Fuels (Twh) Electricity from Renewables (Twh)
Source: Hodes 2013 Science
Elon Musk (Tesla Motors); Wang Chuanfu (BYD); Masayoshi Son (Softbank
The expansion of the global market for solar PV cells, largely supplied from China, has been responsible for driving down costs by 80% since 2008. A universal process: as market expands, costs come down The learning curve Nothing new here. The same principle of industrial expansion coupled with cost reduction established US supremacy in the automotive industry a century ago. Between 1909 and 1916, Henry Ford reduced the cost of his Model T Ford from $950 to $360, a 266% drop over seven years. Each year, sales doubled – from just below 6,000 in 1908 to
Same process is underway with solar PV cells – manufactured devices. Market expansion -> manufacturing efficiencies (division of labor) -> cost reduction -> further market expansion -> further efficiencies -> further cost reductions A chain reaction: Circular and cumulative causation
10/17/2014 24
in 2011to a record of $257 billion , up 17% from 2010
in 2004 and 94% more than the total investment in RE in 2007
$10 billion (unreported) invested in solar hot water
billion invested in large hydropower (>50 MW)
Source: UNEP/Bloomberg: Global Trends in Renewable Energy Investment 2011
Source: Andersen (2002) Fig. 1, based on Mitchell, B.R. (1988) British Historical
not included. The data for 1868–70 are lacking or are problematic.]
Source: McKinseys Global Institute, Financial Globalization: Retreat or Reset? March 2013
Germany and Japan following; US lagging
mitigating climate change – and enhancing energy security, creating new clean jobs, creating new industries and export platforms for tomorrow
Merely create “carbon bubbles” – and do nothing to address stranded assets of “unburnable carbon”
Green bonds, climate bonds, green banks Asian Infrastructure Investment Bank about to be launched Debt drives Schumpeterian creative destruction
1. The current transition to green (clean) technologies is part of a wider transformation of the global business system 2. The first ‘great transformation’ – an unrepeatable bonanza created by capitalist institutions and methods combined with fossil fuels 3. Now after 200 years spreading worldwide, driven by Chindia 6 billion mid-income people by 2050, cf 1 billion in 2000 4. But the western model of industrial capitalism does not ‘scale’ to such an expansion; need new model of green growth 5. A new model IS being developed, particularly by China (+ Germany, Jpn) 6. ‘New model’ based on changes to:
Using financial system and banks to drive investment in green projects
transition from one technoeconomic paradigm to another An uncontrolled social experiment under way – could turn out very badly Cautious grounds for optimism – industrial dynamics of transition
Dominant perspective frames energy futures and the case for renewables and cleantech in terms of their contribution to mitigation of climate change, as well as cleanliness and absence of carbon emissions. By contrast, energy security is generally discussed in terms of security
renewables: we contrast the extraction of energy (fuels), which – in spite of technological change – takes place under diminishing returns, with the harvesting of nature’s renewable energy, which takes place in a process utilizing manufactured devices, where manufacturing generates increasing returns and costs decline along steep learning
energy security. Renewables, manufacturing and green growth: Energy strategies based on capturing increasing returns John A. Mathews a,*, Erik S. Reinert b a Macquarie Graduate School of Management, Macquarie University, Sydney, NSW 2109, Australia b Professor of Technology Governance and Development Strategies, Tallinn University of Technology
Stanford University Press, November 2014