
SLIDE 1
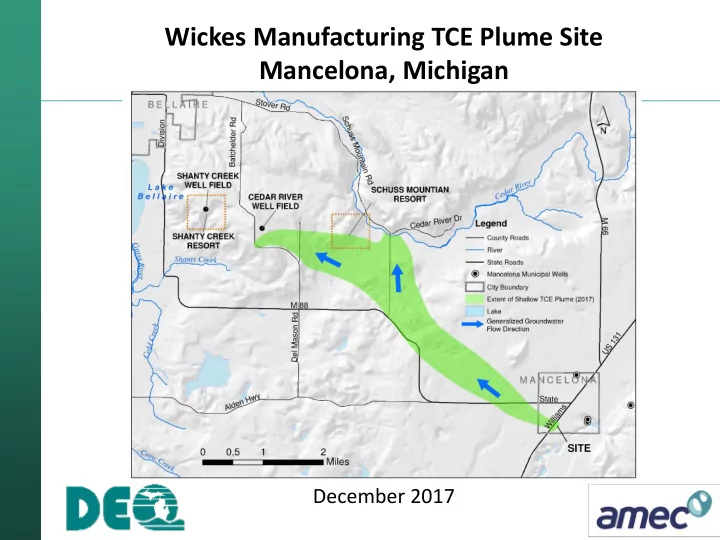
Wickes Manufacturing TCE Plume Site Mancelona, Michigan
December 2017
Wickes Manufacturing TCE Plume Site Mancelona, Michigan December - - PowerPoint PPT Presentation
Wickes Manufacturing TCE Plume Site Mancelona, Michigan December 2017 What is TCE ? Trichloroethylene (TCE) Common Industrial Solvent Known Human Carcinogen Federal and State Safe Drinking Water of 5 g/L or 5 ppb
December 2017
(Proposed level is 0.073 µg/L per Draft September 2017 guidance; however, the typical laboratory detection level for TCE in groundwater ranges from 0.5 to 1 µg/L)
into the groundwater below the property
Automotive
Sample residential wells for TCE Supply bottled water to impacted residents in Mancelona Support municipal water infrastructure system / creation of Mancelona Area Water and Sewer Authority (MAWSA)
FORMER UNTREATED WASTE SEEPAGE LAGOONS FORMER FINAL EFFLUENT POND
FORMER FINAL EFFLUENT POND FORMER UNLINED INDUSTRIAL WASTE LANDFILL FORMER TREATED WASTE SETTLING LAGOONS USE OF UNTREATED WASTE SEEPAGE LAGOON DISCONTINUED IN 1972
FORMER FINAL EFFLUENT POND FACILITY EXPANSION COVERS FORMER UNTREATED WASTE SEEPAGE LAGOON LOCATIONS FORMER TREATED WASTE SETTLING LAGOONS AND INDUSTRIAL WASTE LANDFILL REMOVED IN 1988/89 FORMER FINAL EFFLUENT POND MONITORING WELLS INSTALLED BY THE EPA IN 1986
– Source Area Evaluations (e.g., 2017 soil gas assessment) – Remedial Investigations (e.g., 2017 monitoring well network expansion & downgradient vapor intrusion assessment) – Risk Assessment: Protection of Human Health and Environment – Feasibility Study / Evaluation of Remediation Options – Ongoing Groundwater and Pore Water/Surface Water Sampling – Ongoing Hydrogeologic characterization – Ongoing Public Outreach Support
to define extent of problem and replace impacted groundwater supply in and around Mancelona
which is the direction of the groundwater flow
the Site
2015)
sampling in source area in 2016 & Downgradient)
aquifer(s) following 2016 high pressure water line installation (Mancelona well fields to the CRWF)
SITE SCHUSS Mtn.
From upnorthlive.com - archive
MANCELONA WELL FIELD
VOLATILIZATION (WATER TABLE)
VOLATILIZATION (SOIL)
SOURCE: TCE RELEASED ON THE GROUND AND/OR IN UNLINED SEEPAGE LAGOONS OVER A PROLONGED PERIOD
“Clean Water Blanket” low Volatilization potential
– TCE presents a drinking water risk; TCE is human carcinogenic (EPA, 2011). The drinking water criteria is 5 µg/L. – TCE is a threat to macroinvertebrates where groundwater vents to surface water (GSI) above the GSI criteria of 200 µg/L. – Evaluate potential for TCE to off-gas from groundwater and create an inhalation risk.
MANCELONA WELL FIELD
VOLATILIZATION
(WATER TABLE)
VOLATILIZATION (SOIL) SOURCE
“Clean Water Blanket” low Volatilization potential
Elevated dissolved oxygen and low total organic carbon in saturated zones prevent effective in-situ treatment, for example:
MAWSA Wells: Upgradient of Wickes Site
CRWF Does not withdraw water from this zone Residential Wells use water from different depths within this zone – Health Department Monitoring / municipal water replacement per FS.
Shallow
Shallow Zone
Plume is ~160 feet ABOVE the CRWF screens. Shallow groundwater flows to the northwest near the CRWF but to southwest at leading edge of the plume. TCE is estimated to move at ~450- 625 feet per year 2017 Wells
Based upon data to date, science shows TCE will move past the well field without ever impacting the drinking water.
2016 2012 2008 2005
Regularly Sampled wells
2017- New wells at Shanty Creek Headwaters (Not shown) ~600’
DEQ funded service area expansion (2017)
Intermediate Zone TCE moves at ~100 feet per year (slower because there is more silt and clay). This zone is ~80 feet ABOVE CRWF screens. Intermediate Zone is separated from the Deep Zone by an aquitard (low permeability layer) that varies in thickness (5-feet to 50+feet) The DEQ continues to monitor the intermediate zone and the underlying CRWF aquifer
2017 Well
Routinely Sampled wells
MW-X: Max. TCE in Intermediate Zone (190 ppb, 2016)
Deep Zone TCE moves at less than 50 feet per year (more clay and silt). Very low levels of TCE (1.0 to 1.2 ppb) have been detected at MW- Xd, where clays are very thin. Sampling shows TCE detected at MW-Xd is not related to TCE detected to the southwest
TCE concentrations show declining trends MW-Xd
The DEQ continues to monitor pumping stresses and TCE extent in the Deep Zone, particularly near the CRWF. MAWSA also samples CRWF wells for TCE (never detected)
MAWSA.
high pressure line upgrade from Mancelona in 2016 (less use).
the west lobe of the shallow TCE plume (turning toward Shanty Creek).
water is pumped from the ground, are located in the Deep Zone or the “CRWF Aquifer” (575-feet below ground surface).
Deep (CRWF Water Source) Shallow 2017 Activities: To Shanty Creek?
<1’ >6’ >13’ No measurable Change Water Source for the CRWF
causes water levels in the Deep Zone to drop.
water from Intermediate Zone to Deep Zone is enhanced by water level drop (downward vertical gradient).
gallons per minute (gpm);
5 1 2 3 4 5 6 7 8 9 10 11 12 13
Pressure change (ft of head) Monitoring Period (days)
Drawdown at the CRWF (OW-2)
Oct 26 - Nov 8, 2017 Oct 10 - Oct 17, 2016
slightly when the CRWF was pumped at maximum capacity of (~900 gpm).
water main was extended from Mancelona to the CRWF to:
CRWF water used
frequency
increase water storage capacity at the CRWF to further reduce need for high pumping rates.
2 4 6 1 2 3 4 5 6 7 8 9 10 11 12 13
Pressure change (ft of head) Monitoring Period (days)
Drawdown in Well MW-6uCRWF
Oct 26 - Nov 8, 2017 Sept 26 - Oct 14, 2016
High rate event (hydrant flushing) High rate events common (Pre-Expansion)
potential downgradient receptors and the leading edge of the TCE plume (3 along Windy Hill, 5 near Shanty Creek and 1 along Del Mason Road).
each zone to continue as TCE moves beyond the CRWF area into areas where more residential wells occur.
enhance projection of plume movement in the future.
sample residential wells near the leading edge of TCE in groundwater.
2017 and September 2017 to evaluate average groundwater flux into Shanty Creek.
SG-2 Pond outfall SG-4 Upstream of M-88 Crossing SG-3 Measured profile (Typ.)
Measuring Point Approximate Flow (GPM) Approximate Gain (GPM) SG-2 90 90 SG-3 3295 3205 SG-4 3670 375 M-88 3850 180
Results: In only ~1,200 feet Shanty Creek’s flow increases by ~3,200 gpm (continuously)
Toe of Plume
~3200 feet to northeast (~5-7 years travel time)
200 ppb is ~2.1 miles upgradient (~18-25 years travel time)
VOLATILIZATION (WATER TABLE)
VAPOR INTRUSION
N
N
Soil Gas Probe Monitoring Well 2006 Boring Former degreaser
12 Vapor and 11 Water sample locations. Vapor intrusion less likely when:
water table
Depth to groundwater TCE NOT detected in soil vapor above new, lower screening levels
VOLATILIZATION (WATER TABLE) VAPOR INTRUSION?
“Clean” Water Table
X
MW-31R
Interactive website: https://ifrastructure.amecfw.com/wickes/