
SLIDE 1
1
- !
! ! !" " " "
200 400 600 800 1 000 1 200 1 400
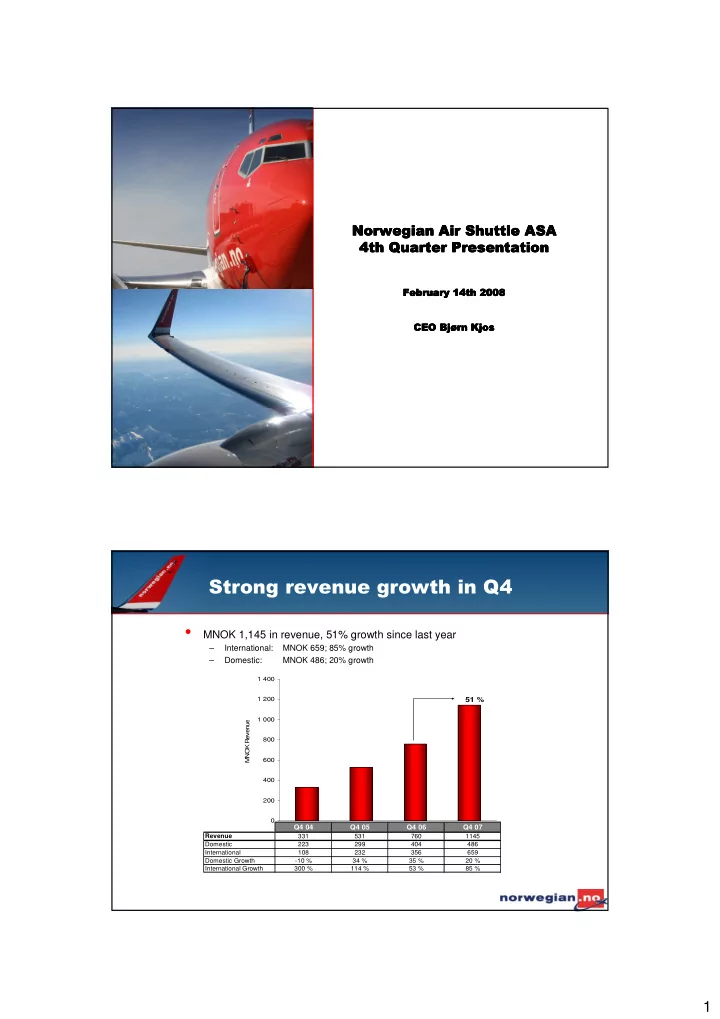
Q 4 4 Q 4 5 Q 4 6 Q 4 7MNOK Revenue
51 %
#
- MNOK 1,145 in revenue, 51% growth since last year
– International: MNOK 659; 85% growth – Domestic: MNOK 486; 20% growth
Q4 04 Q4 05 Q4 06 Q4 07
Revenue 331 531 760 1145 Domestic 223 299 404 486 International 108 232 356 659 Domestic Growth
- 10 %
34 % 35 % 20 % International Growth 300 % 114 % 53 % 85 %