SLIDE 1
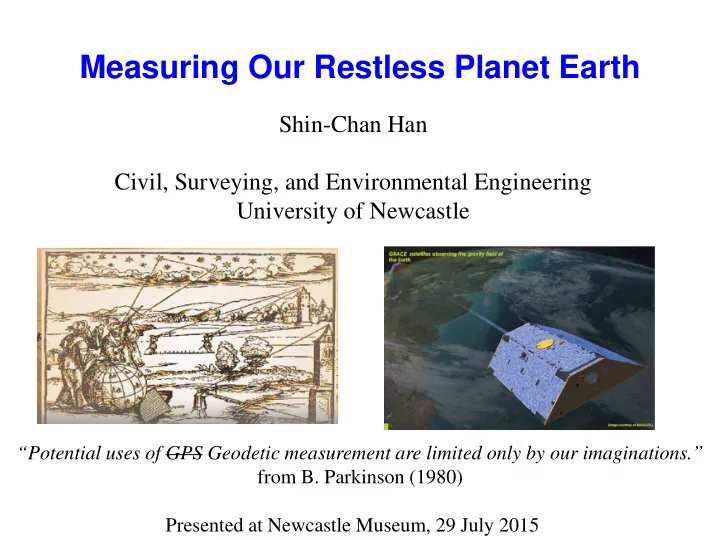
Measuring Our Restless Planet Earth
Shin-Chan Han Civil, Surveying, and Environmental Engineering University of Newcastle
“Potential uses of GPS Geodetic measurement are limited only by our imaginations.” from B. Parkinson (1980) Presented at Newcastle Museum, 29 July 2015
SLIDE 2
His radius of a spherical Earth 6267 km => only 2% error from a modern determination (6371 km) The first measurement of the Earth’s figure in 200 B.C. Eratosthenes (276 – 195 B.C) of Alexandria 5000 stadia (Alexandria-Syene) 1 stadium=157.5 m
SLIDE 3 Measurements of the Earth’s flattening in 1600’s Snellius, Picard, Cassini => Measured the arc measurement and astronomic latitude and found that the meridian arc in the northern part is shorter than the one o the southern part. f = –1/95 (oblong) Newton, Huygens => Computed through gravity theory, the flattening, f =1/230, 1/576 (oblate) Delambre, Mechain => Arc measurements along the meridian
- f Barcelona – Paris – Dunkirk
carried in 1792-1798, f = 1/334 (10% error, f=1/298.257223563 ~ 0.003)
SLIDE 4 Measurements of the Earth-Sun distance (A.U.) in 1769
1779) A explorer and cartographer who obtained Venus transit measurements for the A.U. 1 A.U. = 149,597,870,700 m
SLIDE 5
From the ellipsoid to the ‘physical’ shape (geoid) in 1800’s
In the 19th century, Laplace, Gauss, Bessel, and others already noticed the systematic deviations in their measurements and found the ellipsoidal model is no longer tenable.
Carl Friedrich Gauss (1777–1855) One of those who had an idea of physical shape of the Earth
Quran 79:30 (Sahih International) “And after that He spread the earth.”
SLIDE 6
~6371 km ~10 km ~10 m
SLIDE 7
The first measurement of the pear-shaped Earth in 1959 John O’Keefe (NASA) The pear-shape of the Earth, measured by tracking Vanguard-1 (launched in 1958) The load stress is supported by the mechanical strength and mantle convection.
SLIDE 8
Chicago Tribune 29th January, 1959 The Earth is pear- shaped, but not like the one Columbus thought (in 15th century)!
SLIDE 9
The plumb line follows the direction of the gravity field. The satellite trajectory is determined by the gravity field.
SLIDE 10 The father of space geodesy William M. Kaula (1926-2000)
- Born in Sydney, Australia
- Educated in The Ohio State University
- Worked Space Geodesy at NASA Goddard
- Became a Professor in UCLA
- Most notable in using early earth satellites to produce gravity maps of Earth
(and in very good knowledge of good restaurants from Gerry Schubert)
SLIDE 11
The first measurement of the general shape in 1960’s One of the early determinations of the Earth’s figure (geoid undulation wrt the ellipsoid) by Bill Kaula (1964), and many others.
SLIDE 12
The geoid determined in 2010’s
Results from extensive ground, marine, and airbone survey, from three decades of satellite altimetry, and from decades of tracking multiple spacecraft, from numerous government agencies (incld. Military, NASA, ESA) from various countries. Accuracy ~5 cm at a 9 km scale; 2 cm at 100 km Implications toward Earth interior, tectonics, oceanography, hydrography, surveying, defense, and aerospace, and many more.
=> This is by no means the end of the game, but only a well-started one.
SLIDE 13
These complex processes change the figure, gravitational field, and rotation (polar motion and length of day) of the Earth “Three Pillars of Geodesy” The Earth’s (physical) figure is changing… Concerning change in the figure sub-mm to cm
SLIDE 14
Image by European Space Agency The constituents of ‘g’ Sensitivity of the present technologies ~ <10 nanoGal (ground) – 10 digits after the decimal point ~ 1 microGal (space) – 8 digits Surface gravity, g = 9.8072467…. m/s2
SLIDE 15
Gravity Recovery And Climate Experiment (GRACE) in 2002 Tapley [2014]
CHAMP 2000 GRACE 2002 GOCE 2009 GRAIL 2011 GRACE-FO 2017
Sensitive to mass “movement”: Land water storage Ice mass change Ocean mass change Earthquakes Land deformation Sensitive to track a few cm of water in 3002 - 4002 km2 “Any sufficiently advanced technology is indistinguishable from magic.” Arthur C. Clarke, Profiles of The Future, 1961 (Clarke's third law)
SLIDE 16 Another technique, Satellite Altimetry Measure sea, ice, lake, river, surface height Radial orbit is as good as 2-3 cm Mature techniques, tested since 1973, developed until now, to be
- developed. (~19 s/c, NASA, ESA, CNES, NOAA, US Navy, CNSA)
Measure changing Earth’s surface from a ‘fixed’ trajectory
SLIDE 17 Greenland (& neighboring islands)’s ice sheet has been thinning at a rate of 345 km3/yr
Emerging trends in global mass change (2002 – 2014)
N.B. 1 km3 of water = 1 gigatonne of water = Total water available in the Lake Macquarie (surface area = 110 km2; average depth = 8 m)
Patagonia glacier melt at a rate of 16 km3/yr The Antarctic ice sheet melt at a rate
Alaska glacier melts a rate of 40 km3/yr Groundwater depletion (pumping for irrigation) across northern India at a rate of 54 km3/yr High mountain glacier melts a rate
Recent droughts in southeastern US and Texas 2010 Chile earthquake and drought in southern Argentina Floods in Queensland in 2011-2012 Return to normal after wet years in early 2000s (Great Sandy Desert) Return to normal after droughts ended in 2007 (Okavango Delta) Depletion of water resources in Middle East exacerbated by droughts Overexploitation of freshwater resources in the North China Plain Post-glacial rebound after the historic ice sheet melts
Rodell [2014], Velicogna [2014], Han [2014]
Caused by natural variability, climate change, and anthropogenic activities
SLIDE 18 Post glacial rebound
Mantle viscosity 1020 - 1021 Pa s determined the rate of rebound. Surface deformation and gravity change maps and time-series are being exploited to infer the structure of the Earth interior and its rheology GPS records several mm/yr uplift
SLIDE 19 2004 Mw9.2 Sumatra-Andaman + 2005 Mw8.5 Nias 2004 Mw9.2 Sumatra-Andaman 2012 Mw8.6 Wharton Basin 2007 Mw8.5 Bengkulu 2011 Mw9.0 Tohoku-Oki 2006 Mw8.3 + 2007 Mw8.1 Kuril islands 2009 Mw8.1 Samoa-Tonga 2010 Mw8.8 Maule 2004, 2005, 2007, 2012 2011 2006, 2007 2009 2010
Ice mass loss of the Gulf of Alaska + present-day postseismic gravity change of 1964 Mw Prince William Sound earthquake Ice mass loss of the Patagonian ice field + present-day postseismic gravity change of 1960 Mw9.5 Valdivia earthquake
1964 1960
Emerging trends in global mass change (cont’d)
Large earthquakes also have changed the the figure
- f the Earth, episodically and gradually.
SLIDE 20
[Luthcke et al. 2011] Global Ice Mass Balance Trend (GSFC ‘mascon’ solution)
10 daily time-series of mass change in Giga Ton (GT)
SLIDE 21
- Max. amount of ice in 2007 winter is
similar with the min. in 2005 summer Loss of ice 220 GT/yr (water equivalent)
Ice Mass Balance Trend - Greenland
SLIDE 22 ICESAT elevation changes from Oct 2003 to March 2008
[Sorensen et al., 2011]
<= Measure of geometric height (volume), not mass Challenges to get mass changes:
its changes
- Surface density (firn
- r ice); how one
implements this can cause 30% difference in total mass change
191±23 Gt yr−1 to 240±28 Gt yr−1 for the period October 2003 to March 2008, depending on how one processes the data, very similar in numbers with GRACE results
Derived mass change (ice equivalent)
SLIDE 23
Loss of ice 160 GT/yr (water equivalent)
Ice Mass Balance Trend - Antarctica
SLIDE 24
Loss of ice 40 GT/yr (water equivalent)
Ice Mass Balance Trend - Gulf of Alaska
SLIDE 25
Contribution to sea level (derived from GRACE)
Velicogna [2014] 500 Gt of the ice melts to the ocean every year
Over the last decade 2002 – 2014
SLIDE 26 The global sea-level rise (derived from Altimeters) => 3.3 mm/yr sea level change 10-25 cm rise by 2100 [Meier et al., 2007] The steric (thermal expansion and salinity change) = 1.8 mm/yr
- ver 1993-2003, Ishii et
- al. [2005]
Nerem et al. [2015]
SLIDE 27 [Leuliette and Smith, 2011] Mean Sea Level change: 3.2 mm/yr (1992-present) Blue: direct observation Red: complementary
Sea level: altimeter (TOPEX, Jason, ENVISAT) Ocean mass: GRACE Steric sea level: Argo (array of temperature/salinity profiling floats)
Sea level = GRACE + Steric Steric = GRACE - Sea level GRACE = Sea level - Steric
SLIDE 28
The Australia changing the sea level rise! The Australia – the smallest continent, but the biggest role in the global sea level and climate Fasullo et al. [2013], GRL Credit: Nerem, Willis, Boening
SLIDE 29
Hydrodynamic assimilation of GRACE ocean tide solutions
GRACE solutions and corrections to TPXO7.1 from assimilation Han et al. [2007] and Egbert et al. [2009]
SLIDE 30 Hydrological Cycle (Mass Balance) Land Surface Model P – ET = Q + dS/dt River Routing Model Q along the channel
Example: Amazon Basin Year 2003, bi-weekly
equivalent water height [cm]
Alsdorf, Han, et al. [2010]
SLIDE 31 30 cm/s for upstream cells + faster for downstream cells This mimics backwater effect on the upstream 30 cm/s uniformly applied in the entire basins Spatial pattern is consistent for
Dynamics of surface water
Han et al. [2011]
SLIDE 32 Contemporary research in geodesy for Earth observation
Sciences (geodetic application)
- Solid Earth deformation (earthquake, tsunami, volcanoes,
postglacial, loading, subsidence, tectonics)
- Hydrological cycles (floods, droughts, ground water)
- Atmosphere (troposphere, ionosphere, scintillation)
- Ocean (Ocean circulation, Tides, Bathymetry, Sea Level Rise)
- Cryosphere (Ice mass change, Glacier dynamics)
- Global terrestrial and celestial reference frame, precision orbit
determination
Technologies (geodetic instrument)
- GPS, INS, Radar and laser altimeter, Radar interferometer
(SAR), Gravimetry/Gradiometry, OBP, seafloor surveying, VLBI, SLR
Satellite Remote Sensing (geodetic mission)
- LAGEOS, CHAMP, GRACE, GOCE,
TOPEX/JASON/OSTM, ICESAT, CRYOSAT, SRTM
- GRACE-FO, SWOT, GRACE-II, DESDYNI, ICESAT-II,
LIST
Davis et al. [2012], A Foundation for Innovation: Grand Challenges in Geodesy Hooray for Geodesy! for your horizon being expanded.
SLIDE 33
Mars Reconnaissance Orbiter
SLIDE 34
GRAIL for the Moon MESSENGER for Mercury
SLIDE 35
Image Credit: UNAVCO