
SLIDE 1
Limits by Occupancy
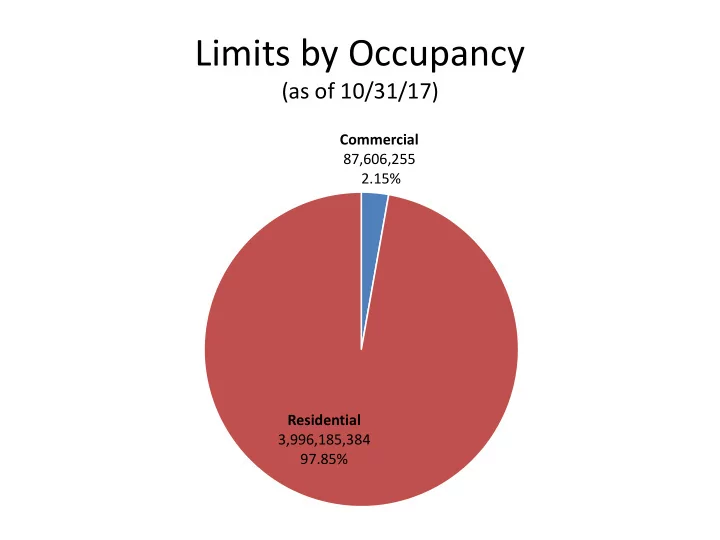
(as of 10/31/17)
Commercial 87,606,255 2.15% Residential 3,996,185,384 97.85%
Limits by Occupancy (as of 10/31/17) Commercial 87,606,255 2.15% - - PowerPoint PPT Presentation
Limits by Occupancy (as of 10/31/17) Commercial 87,606,255 2.15% Residential 3,996,185,384 97.85% Limits by County (as of 10/31/17) 2,500,000,000 2,058,991,577 2,000,000,000 1,436,492,737 1,500,000,000 1,000,000,000 514,161,752
Commercial 87,606,255 2.15% Residential 3,996,185,384 97.85%
15,420,456 514,161,752 2,058,991,577 1,436,492,737 45,121,192 13,603,924 500,000,000 1,000,000,000 1,500,000,000 2,000,000,000 2,500,000,000 GEORGE HANCOCK HARRISON JACKSON PEARL RIVER STONE
Pre-1980 1,543,990,530 38% 1980 - 1989 549,100,948 14% 1990-1999 588,766,586 14% 2000 - Current 1,401,629,287 34%
1.5% 44% 50.8% 0.3% 1.6% 1.8%
Mobile Home Frame Masonry Veneer Masonry Semi- Wind Resistive Wind Resistive
A 26% B 44% C 28% D 2%