
SLIDE 1
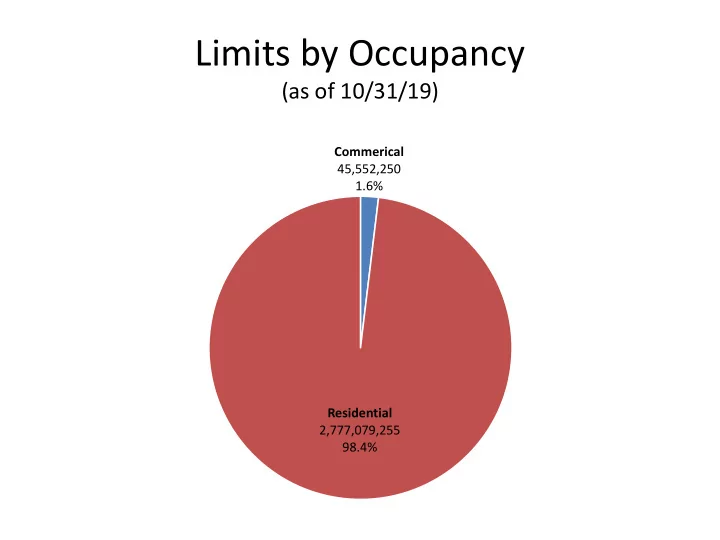
Limits by Occupancy
(as of 10/31/19)
Commerical 45,552,250 1.6% Residential 2,777,079,255 98.4%
Limits by Occupancy (as of 10/31/19) Commerical 45,552,250 1.6% - - PowerPoint PPT Presentation
Limits by Occupancy (as of 10/31/19) Commerical 45,552,250 1.6% Residential 2,777,079,255 98.4% Limits by County (as of 10/31/19) 1,600,000,000 1,433,523,747 1,400,000,000 1,200,000,000 994,060,745 1,000,000,000 800,000,000
Commerical 45,552,250 1.6% Residential 2,777,079,255 98.4%
7,221,729 353,750,610 1,433,523,747 994,060,745 27,321,976 6,752,698 200,000,000 400,000,000 600,000,000 800,000,000 1,000,000,000 1,200,000,000 1,400,000,000 1,600,000,000
George Hancock Harrison Jackson Pearl River Stone
Pre-1980 1,169,363,269 41% 1980-1989 366,595,582 13% 1990-1999 395,269,642 14% 2000-2009 733,834,486 26% 2010- Current 155,738,754 6%
Mobile Home 2% Frame 47% Semi-Wind Resistive 1% Masonry Veneer 48% Wind Resistive 2%
A 28% B 46% C 24% D 1%