
SLIDE 1
5/29/2013 1
MAT 166 – Calculus for Bus/Soc Chapter 3 Notes
The Deriviative David J. Gisch
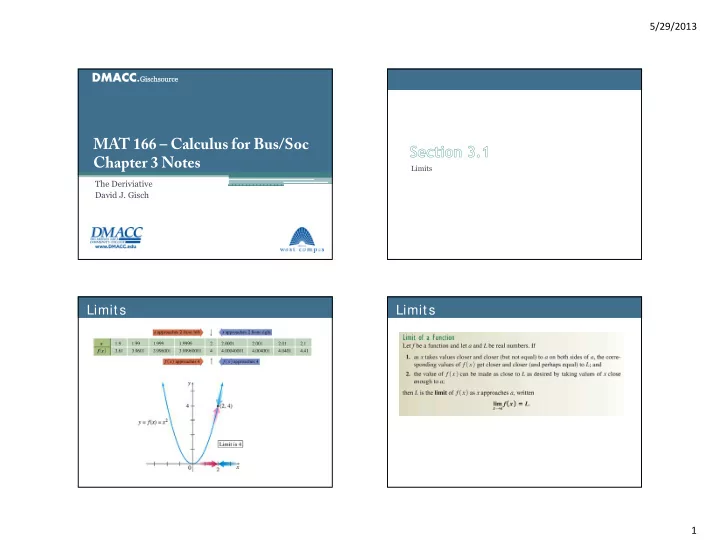
Limits
MAT 166 Calculus for Bus/Soc Chapter 3 Notes Limits The - - PowerPoint PPT Presentation
5/29/2013 MAT 166 Calculus for Bus/Soc Chapter 3 Notes Limits The Deriviative David J. Gisch Limits Limits 1 5/29/2013 Limits Limits Why? Dont they always agree? 2 2 Limits Limits
Limits
2 2
2 1 2
lim
→
lim
→ 3 lim → 4
→ ?
lim
→
12 3
lim
→
1 1
lim
→
2 4
→
lim
→
2 4 6 5 7 Solution: Here, the highest power of (in the denominator) is , which is used to divide each term in the numerator and denominator.
Continuity
At 3 At 0
At 4
At 2
At 1
Rates of Change
5 1 5 2 5
Recall that .
▫ Changes based on velocity (speed).
Definition of Derivative
The graph below shows the risk of chromosomal abnormalities in a child increases with the age of the mother at the child's birth. Find the rate that the risk is rising when the mother is 40 years old.
Graphical Differentiation