SLIDE 1
2018‐19 Budget Presentation Josephine County Public Works
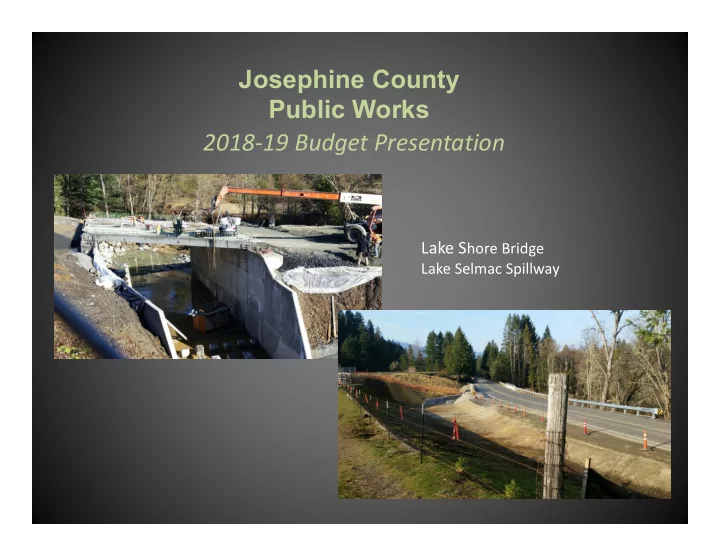
Lake Shore Bridge
Lake Selmac Spillway
SLIDE 2
Robert Brandes, Director
Public Works Operating North Valley Industrial Park Solid Waste County Fleet County Bridge Construction County Transit
SLIDE 3 $‐ $1 $2 $3 $4 $5 $6 $7 $8 $9
2013‐14 2014‐15 2015‐16 2016‐17 2017‐18 2018‐19
Millions
PW ‐ MAJOR REVENUE SOURCE
Surface Transportation Program (STP) Federal Forest Receipts Motor Fuel Tax
SLIDE 4
ADMINISTRATION / ENGINEERING
Jul - Mar Estimate 14-15 15-16 16-17 17-18 18-19 AP Invoices Processed 3266 3210 3002 2558 3000 Service Request Calls 437 556 883 358 600 ODOT Oversize Permits 397 403 427 401 530 Driveway Approach Permits 152 229 281 209 270 Util Encroachment Permits 130 124 142 76 150 Land Developments 56 75 136 52 100
SLIDE 5
OPERATIONS MAINTENANCE SERVICE TYPES
Road Surface Drainage *potholes *ditching/shaping *sinkhole/washout *culvert repair/replace *guardrail *culvert flushing *brooming *debris removal *digouts *flooding Signs/Striping Specialized Maintenance *striping *spills *sign replacement *slides/rock Vegetation *ice/snow removal *chipping *accident cleanup *mowing *debris/animal removal *hazard tree removal Bridge Maintenance *visibility clearing *damage/cracks *tree down on roadway *debris removal
SLIDE 6
PUBLIC WORKS - FTE BY PROGRAM
Admin. Operations Engineering PW Fleet Total FTE's
10-11 9.00 39.00 6.80 8.75 63.55 11-12 9.00 39.00 6.80 8.50 63.30 12-13 7.00 32.50 5.90 7.35 52.75 13-14 7.00 31.00 6.30 7.35 51.65 14-15 7.00 27.00 6.30 7.35 47.65 15-16 7.00 31.00 6.00 7.35 51.35 16-17 7.00 31.00 6.00 7.35 51.35 17-18 7.00 31.00 6.00 7.35 51.35 18-19 7.00 39.00 6.00 7.20 59.20
SLIDE 7 Management Partners Review – July 2017
- 63 Recommendations for improving Department Performance
SLIDE 8 Management Partners Review – July 2017
- 63 Recommendations for improving Department Performance
- Bridge Maintenance – including seismic retrofit
SLIDE 9 Management Partners Review – July 2017
- 63 Recommendations for improving Department Performance
- Bridge Maintenance – including seismic retrofit
- Culvert Maintenance – including replacement, armoring and
flushing
SLIDE 10 Management Partners Review – July 2017
- 63 Recommendations for improving Department Performance
- Bridge Maintenance – including seismic retrofit
- Culvert Maintenance – including replacement, armoring and
flushing
- Vegetation Management – chipping and tree removal
SLIDE 11 OPERATIONS ~ CHIPSEAL
Miles
2006-07 37.72 $ 1,320,200 2007-08 36.22 $ 1,267,700 2008-09 18.87 $ 660,450 2009-10 23.91 $ 836,850 2010-11 18.03 $ 631,050 2011-12 11.58 $ 405,300 2012-13 0.00 $ - 2013-14 25.94 $ 907,900 2014-15 0.00 $ - 2015-16 15.20 $ 532,000 2016-17 0.00 $ - 2017-18 24.95 $ 873,250 2018-19 35.00 $ 1,225,000
06-07 ~ 10-11 Average $ 943,250 11-12 ~ 17-18 Average $ 388,350
SLIDE 12 Preserved vs Non-Preserved County Road
Cost per Mile for 2 Lane Road Over 55 years
Pavement Condition Preserved Non-Preserved Pavement Age (Years)
Very Poor Poor Fair Good Very Good
5 10 15 20 25 30 35 45 55
Rebuild $500,000 Rebuild $500,000 Seal $20,000 Seal $20,000 Overlay $200,000 Seal $20,000 Seal $20,000 Overlay $200,000 Seal $20,000 Seal $20,000 = =
40 50
Initial Building Cost $750,000
The poorer the road, the greater the liability.
Preserved Preserved Total = tal = $520,000 $520,000 Non- Non- Preserved Preserved Total = tal = $1.0 $1.0 Million Million
SLIDE 13
UNANTICIPATED PROJECT
Waters Creek Road Slide Repair $134k
SLIDE 14
UNANTICIPATED PROJECT
N Applegate Road ~ Sinkhole Culvert Replacement $49k
SLIDE 15
ROADS & BRIDGES RESERVE MAJOR PROJECTS
Road Construction
Beacon Dr Widening/Overlay/GPID Fix $ 595,500 G St -to Lincoln Sidewalk $ 276,000 Galice Road - FLAP Guardrail - Grant Match $ 215,000 Granite Hill Road Slide Investigation LS-1-Design $ 60,500 Highland Ave Curb & Gutter $ 330,500 New Hope Road Sidewalk $ 137,500 Upper River Road Cattle Undercrossing Removal $ 53,000 Various - Large Culverts Design / Replacements $ 675,700 $ 2,343,700
SLIDE 16 Road Construction
Expense Revenue Azalea/Robertson Bridge Rd Intersection Changes $186,000 $171,500 Merlin Road MPO - Sidewalks $743,700 $676,000 Sign & Delineation Sign Upgrades - ODOT Grant $238,600 $238,600
ROADS & BRIDGES RESERVE MAJOR PROJECTS REIMBURSEMENT
Merlin Rd ‐ Sidewalks Azalea / Robertson Bridge Rd
SLIDE 17
Bridge Construction
Expense Revenue Sand Creek Bridge Replacement $1,456,000 $1,422,000
ROADS & BRIDGES RESERVE MAJOR PROJECTS REIMBURSEMENT
SLIDE 18
Actual Actual Actual Project Project 2014-15 2015-16 2016-17 2017-18 2018-19 Motor Pool Revenue 833,897 640,527 631,655 639,100 903,000 Equipment Reserve Transfer 32,949 200,092 218,261 229,500 486,000 Direct Bill Vehicle Reimbursements 23,741 22,992 20,589 22,000 22,000
JOSEPHINE COUNTY FLEET
REVENUE SOURCE
SLIDE 19
Motorpool Usage (Does not include Direct Bill) Miles Driven and Vehicle Count
2015-16 2016-17 2017-18 Proj 2018-19 Budget Community Corrections 80,105 15 69,103 16 69,100 15 177,000 15 Forestry 55,718 9 51,274 9 48,800 6 54,000 6 Parks 98,081 14 90,287 19 81,900 17 48,000 5 Sheriff 283,236 31 318,378 29 320,000 30 616,000 35 Transit 463,499 23 443,351 23 450,000 21 499,000 21 All Other Depts 181,938 33 198,087 30 152,500 33 293,800 24 Totals 1,162,577 125 1,170,480 126 1,122,300 122 1,687,800 106