
SLIDE 1
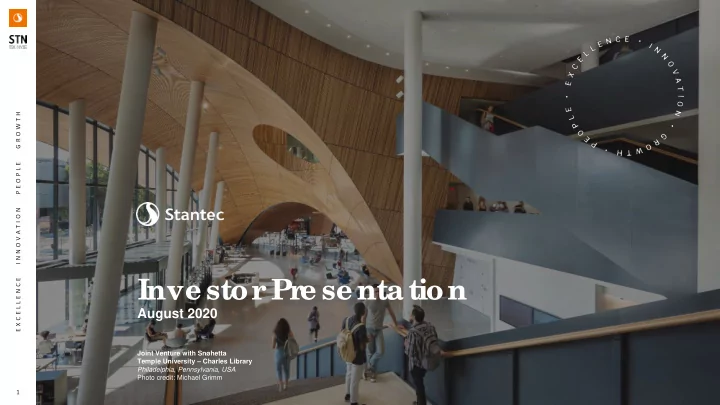
Inve stor Pr e se ntation
August 2020
E X C E L L E N C E I N N O V A T I O N P E O P L E G R O W T H 1 Joint Venture with Snøhetta Temple University – Charles Library Philadelphia, Pennsylvania, USA Photo credit: Michael Grimm
Inve stor Pr e se ntation August 2020 Joint Venture with Snhetta - - PowerPoint PPT Presentation
E X C E L L E N C E I N N O V A T I O N P E O P L E G R O W T H Inve stor Pr e se ntation August 2020 Joint Venture with Snhetta Temple University Charles Library Philadelphia, Pennsylvania, USA Photo credit: Michael Grimm 1
August 2020
E X C E L L E N C E I N N O V A T I O N P E O P L E G R O W T H 1 Joint Venture with Snøhetta Temple University – Charles Library Philadelphia, Pennsylvania, USA Photo credit: Michael Grimm
Cautionar y Note Re gar ding F
war d- L
E X C E L L E N C E I N N O V A T I O N P E O P L E G R O W T H 2
Certain statements contained in this presentation constitute forward-looking information and statements within the meaning of applicable securities law (collectively, "forward-looking statements"). Forward-looking statements in this presentation include, but are not limited to:
target), our anticipated business and geographical mix, our expectations regarding economic and industry trends in the sectors and regions in which we operate, our acquisition strategy, our capital deployment strategy, and our overall growth strategy. These statements provide information about management’s current expectations and plans relating to the future. Readers are cautioned that this information may not be appropriate for other purposes. Stantec does not undertake any obligations to publicly update or revise any forward-looking statements except as required by law. By their nature, forward-looking statements require us to make assumptions and are subject to inherent risks and uncertainties. Readers are cautioned not to place undue reliance on our forward-looking statements since a number of factors could cause actual future results, conditions, actions, or events to differ materially from the targets, expectations, estimates, or intentions expressed in these forward- looking statements. Risk factors include, but are not limited to, the risk of an economic downturn, decreased spending in the private and/or public sectors, changing market conditions for Stantec’s services, and the risk that Stantec fails to capitalize on its strategic
inherent uncertainty of forward-looking statements when relying on these statements to make decisions about our company. For more information about how other material risk factors could affect our results, please refer to the Risk Factor section in our 2019 Annual Report and Q2 2020 Management’s Discussion and Analysis incorporated herein by reference. Readers can access these documents by visiting EDGAR on the SEC website at sec.gov or by visiting the CSA website at sedar.com or on Stantec’s website at stantec.com. In determining our forward-looking statements, we consider material factors including assumptions about the performance of the Canadian, US, and global economies in 2020 and beyond and their effect on our business. These key factors and assumptions are
dollars.
De sign & E ngine e r ing Se r vic e s
E X C E L L E N C E I N N O V A T I O N P E O P L E G R O W T H 3
BUSINESS OPERATING UNITS (TTM Q2 2020 Net Revenue)
WATER ENVIRONMENTAL SERVICES
$1,066M $828M $754M $570M
INFRASTRUCTURE BUILDINGS ENERGY & RESOURCES
$542M
Stantec is a signatory to the UN Global Compact and partners with clients to promote the achievement of the UN’s Sustainable Development Goals For everything from small local projects to iconic mega projects
Dive r sifie d Global F
int – L
e se nc e
E X C E L L E N C E I N N O V A T I O N P E O P L E G R O W T H 4 54% 29% 17%
Distribution of Net Revenue
United States Canada Global
$3.8B
TTM Q2 2020
Stante c at a glanc e
E X C E L L E N C E I N N O V A T I O N P E O P L E G R O W T H 5
65 YEARS
Of Uninterrupted Profitability
CDN $4.9B
(2)
Market Capitalization
STN
TSX & NYSE
350
Locations Worldwide
22,000
Employees Globally
6.6%
10-Year Adjusted Diluted EPS CAGR(1)
(1) TTM Q2 2020 (2) As of August 7, 2020
Infr astruc ture
E X C E L L E N C E I N N O V A T I O N P E O P L E G R O W T H 6
International Ave Pedestrian Realm Calgary, Alberta
Global Canada United States Bridges Transit & Rail Community Development Roadways
Net revenue by geography Q2 2020 YTD Net revenue by sector Q2 2020 YTD Q2 2020 YTD 2020
Organic net revenue growth (retraction)
(1.7%) (0.2%)
Net revenue growth (retraction)
0.4% 1.1%
% of Net Revenue Q2 2020 YTD
Buildings
E X C E L L E N C E I N N O V A T I O N P E O P L E G R O W T H 7
Google Midwest Headquarters Phase IV Chicago, IL, USA
Global Canada United States Science & Technology Airports & Aviation Education Civic Healthcare Industrial Commercial
Net revenue by geography Q2 2020 YTD Net revenue by sector Q2 2020 YTD Q2 2020 YTD 2020
Organic net revenue growth (retraction)
(8.7%) (4.0%)
Net revenue growth (retraction)
(7.0%) 0.0%
% of Net Revenue Q2 2020 YTD
Wate r
E X C E L L E N C E I N N O V A T I O N P E O P L E G R O W T H 8
*
Hyperion Advanced Water Purification Facility Del Mar, Playa del Rey, CA, USA
Global Canada United States
Net revenue by geography Q2 2020 YTD Net revenue by sector Q2 2020 YTD
Client Enterprise Systems Water Treatement Stormwater Water Resources Wastewater Treatment Conveyance
Q2 2020 YTD 2020
Organic net revenue growth (retraction)
3.4% 4.5%
Net revenue growth (retraction)
5.3% 5.4%
% of Net Revenue Q2 2020 YTD
E nvir
vic e s
E X C E L L E N C E I N N O V A T I O N P E O P L E G R O W T H 9
Lower Powers Creek West Kelowna, British Columbia
Global Canada United States Mining Community Development Transportation Power & Dams Buildings Water Oil & Gas
Net revenue by geography Q2 2020 YTD Net revenue by sector Q2 2020 YTD Q2 2020 YTD 2020
Organic net revenue growth (retraction)
(3.7%) 1.0%
Net revenue growth (retraction)
(1.6%) 2.2%
% of Net Revenue Q2 2020 YTD
E ne r gy & Re sourc e s
E X C E L L E N C E I N N O V A T I O N P E O P L E G R O W T H 10
Dokie Wind Energy Project British Columbia
Global Canada United States WaterPower & Dams Mining Power Oil & Gas
Net revenue by geography Q2 2020 YTD Net revenue by sector Q2 2020 YTD Q2 2020 YTD 2020
Organic net revenue growth (retraction)
2.0% 6.2%
Net revenue growth (retraction)
2.8% 6.3%
% of Net Revenue Q2 2020 YTD
E X C E L L E N C E I N N O V A T I O N P E O P L E G R O W T H 11
Bridge Replacement Design for a Structure on Sturgeon Road over Sturgeon Creek Winnipeg, Manitoba, Canada
Ke y Dr ive r s by Busine ss Ope r ating Unit
E X C E L L E N C E I N N O V A T I O N P E O P L E G R O W T H 12
COVID-19 Long-term Impact Business Operating Unit % of Net Revenue (Q2 2020 YTD) Key Drivers Water
21%
▲ Multi-year frameworks for water utilities in UK and AUS; acceleration of UK AMP contract awards ▲ Likely to benefit if governments implement stimulus programs ▲ Investment drivers – climate change, water availability, sustainability. Infrastructure
28%
▲ Majority of projects are continuing as “essential” aside from slowdown in community development ▲ Likely to benefit if governments implement stimulus programs ▬ Investment drivers – state of good repair, urbanization, transportation, mass transit, etc. Buildings
22%
▲ Post COVID-19 requirements for workplace, education and healthcare environments ▼ Decrease in commercial and hospitality projects ▬ Investment drivers – healthcare, remote education / office working, connectivity Environmental Services
14%
▲ Opportunities to develop greenfield sites will increase post COVID-19, renewable energy surge ▼ Largely funded by private sector: energy & resource, industrial sector and land development ▬ Investment drivers – environmental stewardship as a public priority in most jurisdictions Energy & Resources
15%
▲ Midstream projects are continuing ▼ Largely funded by private sector ▬ Investment drivers – commodity prices, climate change, energy transition, green policies
Degree of Impact Less Impacted More Impacted
Public sector revenue >50% | Variable fee revenue >50%
Ge ogr aphic Re gion % of Ne t Re ve nue (YT D) Outlook
United States
55%
except Water, with a slightly more pronounced decline in Q4 20 due to the seasonal slowdown
Canada
28%
to experience the typical seasonal downturn in activity
Global
17%
in Q4 20
New Zealand are expected to offset the impact of COVID-19 related project slowdowns
2020 Ne t r e ve nue outlook
2 0 2 0 O U T L O O K 13
Full-year 2020 net revenue expected to be comparable to 2019
2020 Outlook
2 0 2 0 O U T L O O K 14
Net Revenue and Adjusted Earnings
Leverage Liquidity & Capital Allocation
Continued balance sheet strength and disciplined capital deployment
Ma'Amir & North Refinery Industrial Area Sewage Treatment Plant
E SG le ade r ship that dr ive s value
E X C E L L E N C E I N N O V A T I O N P E O P L E G R O W T H 15
Stante c ’s E SG fr ame work
E X C E L L E N C E I N N O V A T I O N P E O P L E G R O W T H 16
Stantec is a signatory to the UN Global Compact and has adopted the UN’s sustainable development goals (SDGs)
Member of the UN Global Compact CFO Taskforce for the SDGs
In addition to UN SDGs, Stantec’s programs take into account
GRI, TCFD, SASB, and CDP
E nvir
ship
E X C E L L E N C E I N N O V A T I O N P E O P L E G R O W T H 17
Stewardship and innovation that drives value
Stantec’s recognized leadership in sustainable design helps win projects
Recent accolades
Corporate Knights 2020
Ranked as Top 100 Most Sustainable Companies in the World
CDP Climate Leader
2019 CDP score of A-
Top 100 Smart City Partners
Newsweek magazine
*ENR – Engineering News-Record Magazine
Industry Recognition*
#1
Green design firm for educational facilities
#1
International design firm for sewer and waste
#2
International design firm for water
#2
Green building firm
#2
Design firm in power for hydro plants
#4
Design firm in power for wind power
#4
Design firm in North America
#8
Environmental Firm
#11
Design firm in the world 1 2 3 4 5 14 15 16 17 18 19
Metric Tons CO2 Equivalent
Emissions per Employee by Year
Scope 1 and 2 Scope 3
In 2019 we achieved a 39% reduction in scope 1 and 2 emissions per employee from our 2013 baseline – We expect to surpass our 2028 reduction target of 40%
E X C E L L E N C E I N N O V A T I O N P E O P L E G R O W T H 18
Stantec’s SaferTogether™ culture encourages safe choices so our people return home safely each
metrics continue to improve
Soc ial le ade r ship
Embracing and engaging diverse groups
Improves the performance of our business and our ability to support clients. STN in included in the Bloomberg Gender-Equality and Jantzi Social Indexes Stantec attracts, retains, develops, and rewards talent by paying fairly, providing benefits with meaningful choices and offering a consistent global approach while being sensitive to local market practices. Employee Retention: Targeting < 12% voluntary turnover Global Compact Network Canada - Gender Equality Leadership in the Canadian Private Sector Project
Empowerment Principles. Board of Director Composition Currently expanding our long-term support for diversity and inclusion programs with a focus on Black, Indigenous and People of Color communities around the world. Inclusion and Diversity: Targeting > 85% engagement
Gender 38% Female 62% Male
Str
nanc e
E X C E L L E N C E I N N O V A T I O N P E O P L E G R O W T H 19
A diverse board and values-based leadership
A board dominated by independent directors from exceptional backgrounds and leadership driven by clear values position Stantec for the future
Environmental and Social Factors 63% highly experienced 25% general experience 12% limited experience Governance 100% highly experienced
Board Composition and Experience
How Stantec’s people conduct themselves has a direct impact on the integrity of both the Company and the institutions in the jurisdictions where we operate
compliance with mandatory ethics training in 2019
Our Str ate gic Plan
(L aunc hed Dec embe r 3, 2019)
E X C E L L E N C E I N N O V A T I O N P E O P L E G R O W T H 20
SEVA résidences – foot bridge and marsh development Candiac, Québec
Our vision
E X C E L L E N C E I N N O V A T I O N P E O P L E G R O W T H 21
T
m that maximize s long- te r m, sustainable value
Pure play design focus Strong alignment with shareholders Earnings growth Disciplined capital allocation
Peace River Regional Reservoir Bradenton/DeSoto County, Florida, United States
Our
tunity
E X C E L L E N C E I N N O V A T I O N P E O P L E G R O W T H 22
US$24T
TOTAL SPEND IN THE NEXT DECADE
1) United Nations by 2030 2) Navigant Research by 2030 3) IEA by 2025
Key Market Trends
Climate change, Urbanization, Geopolitics and breakthrough technology
STRATEGIC GROWTH OPPORTUNITIES
US$2T
ADDRESSABLE ENGINEERING AND DESIGN SPEND
SMART CITIES AND URBAN PLACES ENERGY REMIX
US $300B1 US $9,000B1 US $1,700B2 US $13,040B3
COASTAL RESILIENCE ECOSYSTEM RESTORATION
Our str ate gy
E X C E L L E N C E I N N O V A T I O N P E O P L E G R O W T H 23
We will do this through
Strong execution, efficient operations, and disciplined capital allocation while delivering a great client experience.
We will measure our success through
Strong earnings per share growth, improved returns on invested capital, balance sheet stability, employee engagement and client satisfaction.
T
sify sustainably for the be ne fit of
c lie nts, e mploye e s and shar e holde r s.
Share buyback
Focused on achieving the best risk adjusted returns
Our c apital alloc ation philosophy
E X C E L L E N C E I N N O V A T I O N P E O P L E G R O W T H 24
Sustaining CapEx Maintaining a strong balance sheet Base dividend
Excess Cash Flow Operating cash flow
Growth Our core commitments Competing capital for the best risk adjusted returns Organic and innovation Acquisitions EPS Growth
Our T ar ge ts
E X C E L L E N C E I N N O V A T I O N P E O P L E G R O W T H 25 Ruwais Marina District Rumais, Abu Dhabi, UAE
CAGR
Of net revenue
Net revenue Adjusted EBITDA margin Return on invested capital Adjusted earnings per share
CAGR
Fremont Water Pollution Control Center Expansion Fremont, OH, USA E X C E L L E N C E I N N O V A T I O N P E O P L E G R O W T H 26
Continuing to e xe c ute our str ate gy
2 0 2 0 O U T L O O K 27
Innovation
Growth
People
Excellence
E X C E L L E N C E I N N O V A T I O N P E O P L E G R O W T H 28 Lyu-Chuan - Shin Sei Green Waterway Taichung City, Taiwan
Q 2 2 0 2 0 29
Long-term strategy of delivering value through diversified business model
United States Canada Global
gross revenue backlog
Growth in Q2 Adjusted Diluted EPS
Solid Q2 r e sults
Organic growth (retraction)
2.3% (6.8)% (7.4)%
Q2 net revenue
$532M $261M $158M
100 200 300 400 500 600 ($ millions)
Q2 20 Q2 19
Solid ne t r e ve nue ge ne r ation in Q2
Q 2 2 0 2 0 30
UNITED STATES CANADA GLOBAL
Q2 Net revenue stable year-over-year at:
2.1% organic retraction
Organic growth (retraction)
(1.7)% (8.7)% 3.4% (3.7)% 2.0%
Q2 net revenue
$272M $202M $201M $141M $135M
100 200 300 ($ millions)
Q2 20 Q2 19
Busine ss line dive r sity bolste r s Stante c ’s r e silie nc y
Q 2 2 0 2 0 31
WATER ENVIRONMENTAL SERVICES INFRASTRUCTURE BUILDINGS ENERGY & RESOURCES
Unite d State s
Q2 20 Net revenue growth 6.0% Organic net revenue growth 2.3% Backlog ($ millions) $2,781 Gross Margin 52.9%
Q 2 2 0 2 0 32
$532 $502
$0 $200 $400 $600 $800 Q2 20 Q2 19 ($ millions)
Gross & Net Revenue
Martin County, Florida Substation Lake Mary, Florida
2.3% organic growth in Q2
commencement of several large projects and continuation of existing programs
projects that more than offset pandemic-related slowdowns
in the commercial, airports, and hospitality sectors
Net Revenue Gross Revenue
Canada
Q2 20 Net revenue retraction (6.8)% Organic net revenue retraction (6.8)% Backlog ($ millions) $1,163 Gross Margin 48.5%
Q 2 2 0 2 0 33
$261 $280
$0 $200 $400 $600 $800 Q2 20 Q2 19 ($ millions)
Gross & Net Revenue
University of Manitoba Museum Phase II Winnipeg, MB, Canada
6.8% organic retraction in Q2
the COVID-19 pandemic
Development particularly affected
project slowdowns in field work
projects
large light-rail transit projects in Edmonton, Montreal, and the greater Toronto area
Net Revenue Gross Revenue
Global
Q2 20 Net revenue retraction (7.9)% Organic net revenue retraction (7.4)% Backlog ($ millions) $769 Gross Margin 51.7%
Q 2 2 0 2 0 34
$158 $171
$0 $200 $400 $600 $800 Q2 20 Q2 19 ($ millions)
Gross & Net Revenue
University of Manitoba Museum Phase II Winnipeg, MB, Canada Center Parcs, Longford Forest County Longford, Ireland
7.4% organic retraction in Q2
European Environmental Services
Latin America
with increased work in Australia
Net Revenue Gross Revenue
Q2 2020 r e sults
Q 2 2 0 2 0 35
$954 $953 $901 $955 $951
Q2 19 Q3 19 Q4 19 Q1 20 Q2 20
2.3% 7.4% 5.3% 4.2% (2.1)%
Net revenue & organic growth (retraction)
($ millions, %)
$145 $159 $143 $140 $143
Q2 19 Q3 19 Q4 19 Q1 20 Q2 20
15.2% 16.7% 15.8% 14.6% 15.0%
Adjusted EBITDA and margin
($ millions, %) Q2 20 Q2 19 Change
(In millions of Canadian dollars, except per share amounts and percentages) $ % of Net Revenue $ % of Net Revenue % Year-
change Net revenue 951.1 100.0 953.6 100.0 (0.3)% Gross margin 489.7 51.5 517.5 54.3 (5.4)% Administrative and marketing expenses 344.0 36.2 372.4 39.1 (7.6)% EBITDA from continuing operations(1) 144.9 15.2 145.9 15.3 (0.7)% Net income from continuing operations 52.6 5.5 49.3 5.2 6.7% Diluted earnings per share (EPS) from continuing operations 0.47
Adjusted EBITDA from continuing operations(1) 142.5 15.0 145.4 15.2 (2.0)% Adjusted net income from continuing operations(1) 57.7 6.1 56.1 5.9 2.9% Adjusted diluted EPS from continuing operations(1) 0.52
(discussed in the Definitions section of Stantec's 2019 Annual Report and Q2 2020 Management's Discussion and Analysis).
0.5 1 1.5 2 Q2 19 Q3 19 Q4 19 Q1 20 Q2 20
Net debt to adjusted EBITDA(1) (TTM)
Balanc e she e t str e ngth
Q 2 2 0 2 0 36
Target range
1.0 - 2.0x
Net debt to adjusted EBITDA(1)
1.0x at June 30, 2020
70 75 80 85 90 95 Q2 19 Q3 19 Q4 19 Q1 20 Q2 20
Days sales outstanding
Target
90 days
Days sales outstanding
82 days at June 30, 2020
(1) Net debt to adjusted EBTIDA and days sales outstanding are non-IFRS measures.(discussed in the Definitions section of Stantec's 2019 Annual Report and Q2 2020 Management's Discussion and Analysis).
L iquidity and c apital alloc ation
(Co mpariso ns to Q2 2019)
Q 2 2 0 2 0 37
$115 $94 $204 ($85) $210
Q2 19 Q3 19 Q4 19 Q1 20 Q2 20
Free cash flow(1)
($ millions)
$16 $16 $17 $16 $17 $12 $17 $33
Q2 19 Q3 19 Q4 19 Q1 20 Q2 20
Dividends Share buy backs
Capital returned to shareholders
($ millions)
Cash flow from continuing operations
(millions of Canadian dollars)
Q2 20 Q2 19 Inflow (Outflow) Operating 251.5 162.3 Investing (11.2) (18.6) Financing (100.4) (83.0) Net 139.9 60.7
(1) Free cash (out)flow is defined as operating cash flows less capital expenditures and net payment of lease obligations. E X C E L L E N C E I N N O V A T I O N P E O P L E G R O W T H 38