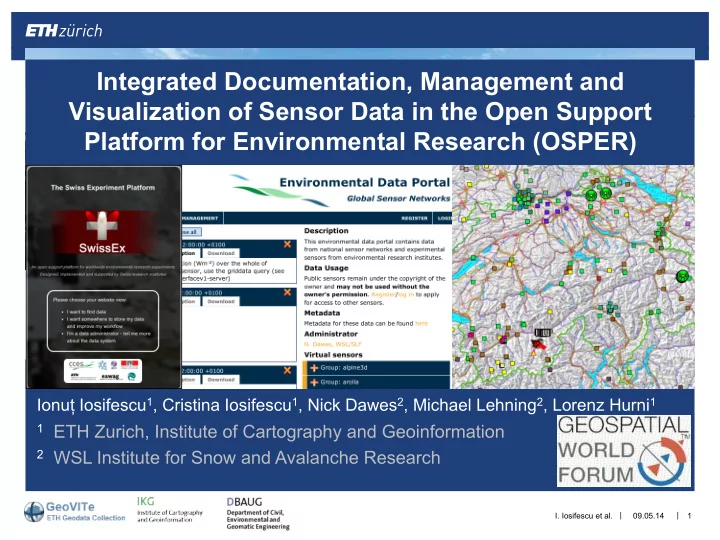
integrated documentation management and visualization of
play

Integrated Documentation, Management and Visualization of Sensor - PowerPoint PPT Presentation

Integrated Documentation, Management and Visualization of Sensor Data in the Open Support Platform for Environmental Research (OSPER) Ionu Iosifescu 1 , Cristina Iosifescu 1 , Nick Dawes 2 , Michael Lehning 2 , Lorenz Hurni 1 1 ETH Zurich,


  1. Integrated Documentation, Management and Visualization of Sensor Data in the Open Support Platform for Environmental Research (OSPER) Ionu ț Iosifescu 1 , Cristina Iosifescu 1 , Nick Dawes 2 , Michael Lehning 2 , Lorenz Hurni 1 1 ETH Zurich, Institute of Cartography and Geoinformation 2 WSL Institute for Snow and Avalanche Research | | I. Iosifescu et al. 09.05.14 1

  2. Demonstration OSPER/SwissExperiment | | I. Iosifescu et al. 09.05.14 2

  3. SwissExperiment / OSPER § OSPER = Open Support Platform for Environmental Research § Main goal: a sustainable support infrastructure for data acquisition, management and visualization § Enables new advances in science through: § Sharing of resources § Common access point for experimental data § Documentation and safe (but visible) storage of experimental data § Combination of diverse data sources (experimental, geodata, archive data, documents, additional multimedia information, … ) | | I. Iosifescu et al. 09.05.14 3

  4. OSPER Infrastructure Components 1. Data documentation system (SwissEx Semantic Wiki) 2. Sensor data management system (GSN) 3. Service-driven Web GIS platform (powered by GeoVITe) | | I. Iosifescu et al. 09.05.14 4

  5. SwissExperiment Semantic Wiki | | I. Iosifescu et al. 09.05.14 5

  6. SwissExperiment Semantic Wiki | | I. Iosifescu et al. 09.05.14 6

  7. Handling of Sensor Measurements § First option: use a database or SWE § (Automatic) sensor measurements import into spatially enabled database (PostgreSQL/PostGIS) § Advantage: use of spatially enabled database/WPS means no additional effort to integrate with GIS § Disadvantage: high implementation effort for loading the sensor data into the database (different types of sensors, hardware dependent, etc … ) | | I. Iosifescu et al. 09.05.14 7

  8. Handling of Sensor Measurements § Second option: use GSN § Advantage: facilitates the deployment and programming of sensor networks § Disadvantage: interoperability with GIS had to be additionally implemented (via GML) and maintained | | I. Iosifescu et al. 09.05.14 8

  9. Global Sensor Networks | | I. Iosifescu et al. 09.05.14 9

  10. GeoVITe GIS Platform for Environmental Research | | I. Iosifescu et al. 09.05.14 10

  11. GeoVITe § Geo data V isualization and I nteractive T raining E nvironment § Web-platform for straightforward geodata visualization, selection and download § An official distribution channel for geodata at ETH Zurich for research and educational purposes § User-friendly, easy to use § Fast access to data § Modern | | I. Iosifescu et al. 09.05.14 11

  12. GeoVITe – Simple and Effective | | I. Iosifescu et al. 09.05.14 12

  13. Conclusions § Integrated documentation, management and visualization of sensor data § Flexible infrastructure in respect with changing requirements and APIs § User-friendly visual data mining of existing datasets (without the need for a catalog) § Outlook: § Increase performance and reliability (for wiki, GSN and GeoVITe) § Improve the public GIS platform prototype | | I. Iosifescu et al. 09.05.14 14

  14. Thank you for your attention!

Download Presentation
Download Policy: The content available on the website is offered to you 'AS IS' for your personal information and use only. It cannot be commercialized, licensed, or distributed on other websites without prior consent from the author. To download a presentation, simply click this link. If you encounter any difficulties during the download process, it's possible that the publisher has removed the file from their server.

Recommend


More recommend