hycom is a hybrid coordinate model based on micom and is
play

HYCOM is a hybrid coordinate model based on MICOM and is able to - PowerPoint PPT Presentation

HYCOM is a hybrid coordinate model based on MICOM and is able to interchange between different coordinate schemes. It is a primitive equation general circulation model. The vertical coordinates remain isopycnic in the open stratified ocean. In


  1. HYCOM is a hybrid coordinate model based on MICOM and is able to interchange between different coordinate schemes. It is a primitive equation general circulation model. The vertical coordinates remain isopycnic in the open stratified ocean. In 
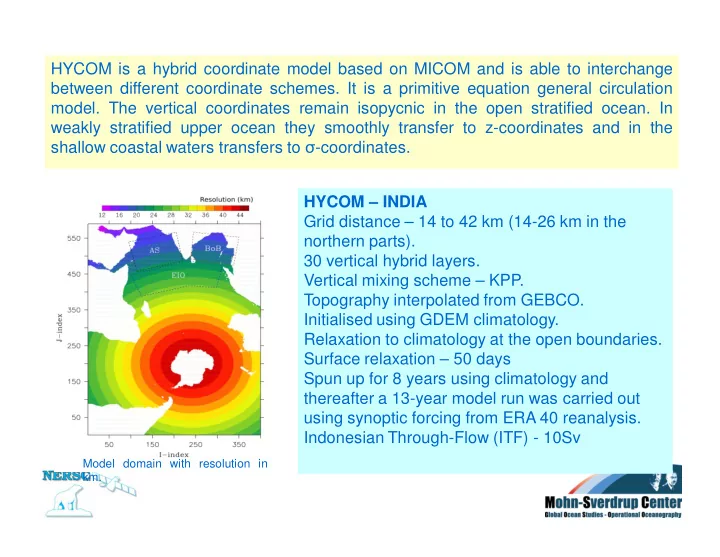
weakly stratified upper ocean they smoothly transfer to z-coordinates and in the shallow coastal waters transfers to � -coordinates. HYCOM – INDIA Grid distance – 14 to 42 km (14-26 km in the northern parts). 30 vertical hybrid layers. Vertical mixing scheme – KPP. Topography interpolated from GEBCO. Initialised using GDEM climatology. Relaxation to climatology at the open boundaries. Surface relaxation – 50 days Spun up for 8 years using climatology and thereafter a 13-year model run was carried out using synoptic forcing from ERA 40 reanalysis. Indonesian Through-Flow (ITF) - 10Sv Model domain with resolution in km.

  2. Satellite Data Atmospheric SLA, SST Data In Situ Data Indian Ocean model EnKF Arabian Sea Data assimilation model system Coastal model Seasonal circulation Ocean forecasting Inter-decadal Coastal in response to the variability dynamics capabilities monsoon Improve the understanding of the ocean circulation and variability in the Indian Ocean and its predictability in response to the monsoon system

  3. Surface currents simulated by HYCOM, average of 8 years, 1994-2001 George, Johannessen et al, 2010

  4. �������������������

  5. �������������������������� �������������� Johannessen et al. (1981)

  6. ����������������������� ������ � ����������������������������������������������������������������� ������������������� ����!��"�� � �����������������������#���� �������� $����������!���%�&��%'�� ������������������������������ �� ��""��()%&(*� � +��!����,�-���������������������������-��������(..(��$������ � ���/�,�����������������������$��"0 �� �1����������� �������������� -2���������������!���'�&������ ������������������ ��� �1'��� (...�1...33. � +��!����,�-���������������������������-��������(..(������� ���� �������!�����0��������� ����!��"�� � �����������������������#���� ����� ���$������ ������������������������� ��� �3���""��3(�&33% � +��!����,�-���������-��������(..(��4����������������54�������6� ���������������1����������$������� ����� ��������������� �� ��""�� �33&�'�

  7. ��������������������������������� ��� ���!"�#���������� $�$�%$�%������&����������'�&������������(����� )('*�( '+%,������������*��������!������ -./-0�1��������-2�- *���3������

  8. Rising sea levels will increase coastal erosion.

  9. Coastal erosion and flooding Changes in sea level lead to: � changes in wave pattern and peak water height (storm surges) � increases in coastal erosion. � Sea-level rise resulting from global warming will exacerbate natural variability in sea level and local tides. � In the past century, about 70 per cent of the world’s sandy shorelines have retreated. Further erosion is expected as sea level continues to rise. These changes, combined with changes in the frequency and intensity of severe storms due to climate change, will increase the risk of coastal flooding and erosion.

  10. Several regions are vulnerable to coastal flooding caused by future relative or climate-induced sea-level rise. At highest risk are coastal zones with dense populations, low elevations, appreciable rates of subsidence, and/or inadequate adaptive capacity. 2� ����������1�7������(.�.

  11. *�������������4�����(������(������������ ������������������� ������������������������������������������� �!������"��������� �����������#�$������������������#�%������� "�������&�'��� ����� �����������(������������������#�($������� )���������'��� ����� ������������#������������������#�*������� +��&�,�����-����.��� �����������/�#�$�����������������0 ���������������������� �����������������������������������������

  12. �������(��&���������& •Warming •ice/snow melting •Increase run-off •Wildcard - Greenland Ice Sheet •Deep water formation conveyour belt •Strong natural variablity Warm surface waters Cold Arctic waters Cold deep waters River runoff

  13. Ice sheet mass balance Total mass balance = Surface mass balance – Iceberg calving – Bottom melting Accumulation – Sublimation– Meltwater runoff

  14. )�����5�����6�������� Teleconnection between low and high littitude Courtesy M. Bentsen, NERSC

  15. �������&���������������������������������-2������� -�������������" The red curve is based on tide gauge measurements (10). The black curve is the altimetry record (zoomed over the 1993 –2009 time span) (15). Projections for the the 21st century are also shown. The shaded light blue zone represents IPCC AR4 projections for the A1FI greenhouse gas emission scenario. Bars are semi-empirical projections 2� ����������1�7������(.�.

  16. '�����������/����������������&���������������&����� 76���89*�������3�#����/�:-3��1 3�%'�/�:-3����� %������ &�������;���������������� ����������-����#���� -22��7�<;" 2� ����������1�7������(.�.

  17. The Indian Ocean Sea Level has not increased since early 2007. Also note the multiple swings in sea level during 1996 and 1997, leading up to the El Nino of 1997/98.

  18. reveals the significant rise in 1998 associated with the 1997/98 El Nino

  19. Sea level anomaly (SLA in cm) average of 8 years (1994-2001) from HYCOM (top) and From altimeter measurements(middle). Blue negative anomaly, orange positive. Contour interval 5cm. George, Johannessen et al, 2010

  20. ����������������

  21. ������������������=�'����� ���������������&���������� �����#�������"���0���!�������������� �� � �������������������� ���������������!� � $� ������!�����������"��������������� �����#����������!�������� ��� ����������

  22. Results from the Recent Large Area Total Balance Measurements Source: AMAP, 2009. The Greenland Ice Sheet in a Changing Climate: Snow, Water, Ice and Permafrost in the Arctic (SWIPA) 2009.

Download Presentation
Download Policy: The content available on the website is offered to you 'AS IS' for your personal information and use only. It cannot be commercialized, licensed, or distributed on other websites without prior consent from the author. To download a presentation, simply click this link. If you encounter any difficulties during the download process, it's possible that the publisher has removed the file from their server.

Recommend


More recommend