
SLIDE 1
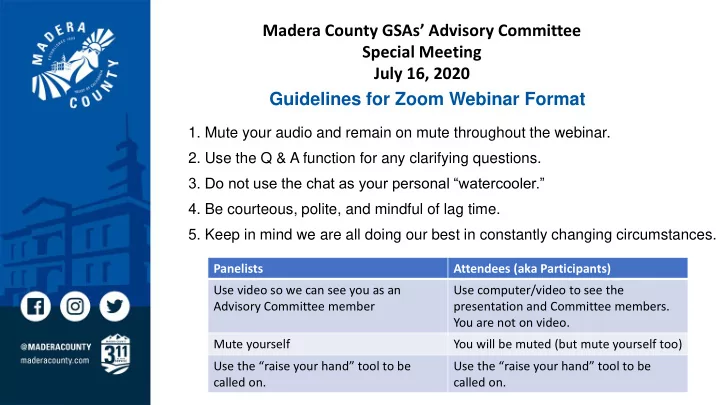
Guidelines for Zoom Webinar Format
- 1. Mute your audio and remain on mute throughout the webinar.
- 2. Use the Q & A function for any clarifying questions.
- 3. Do not use the chat as your personal “watercooler.”
- 4. Be courteous, polite, and mindful of lag time.
- 5. Keep in mind we are all doing our best in constantly changing circumstances.
Panelists Attendees (aka Participants) Use video so we can see you as an Advisory Committee member Use computer/video to see the presentation and Committee members. You are not on video. Mute yourself You will be muted (but mute yourself too) Use the “raise your hand” tool to be called on. Use the “raise your hand” tool to be called on.
Madera County GSAs’ Advisory Committee Special Meeting July 16, 2020