
SLIDE 1
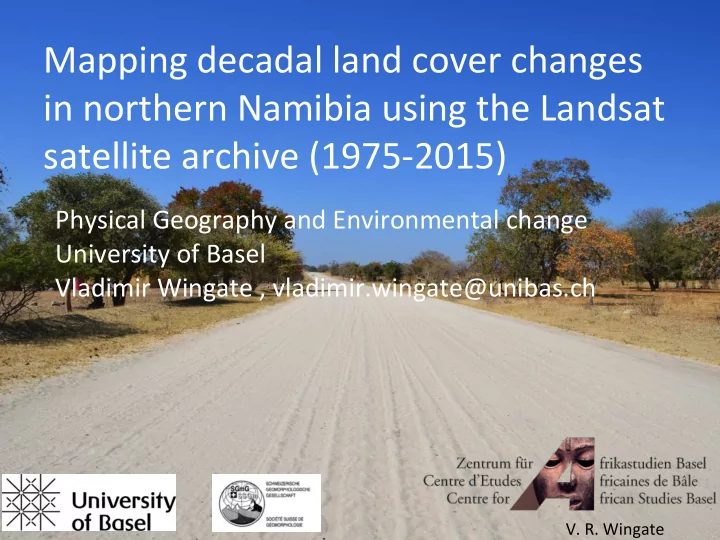
Mapping decadal land cover changes in northern Namibia using the Landsat satellite archive (1975-2015)
Physical Geography and Environmental change University of Basel Vladimir Wingate , vladimir.wingate@unibas.ch
- V. R. Wingate
2014