
SLIDE 1
Robinson projection
Figure 1. Lights at Night, 2008
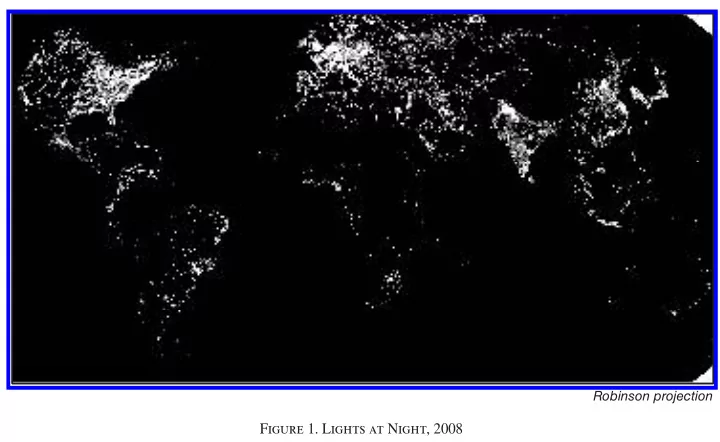
Figure 1. Lights at Night, 2008 1992 2008 Digital Number High : - - PowerPoint PPT Presentation
Robinson projection Figure 1. Lights at Night, 2008 1992 2008 Digital Number High : 63 Low : 0 0 25 50 100 km Universal Transverse Mercator projection Universal T ransverse Mercator projection Figure 2. Long-Term Growth: Korean
Robinson projection
Figure 1. Lights at Night, 2008
2008
Digital Number
High : 63 Low : 0 50 100 25 km
1992
Figure 2. Long-Term Growth: Korean Peninsula
Universal T ransverse Mercator projection
Figure 3. Asian Financial Crisis: Java, Indonesia Year
Actual ln(GDP) ln(GDP) predicted by lights
35.2 35 34.8 34.6 1992 1994 1996 1998 2000 2002 2004 2006 2008
1997 1998
Digital Number
High : 63 Low : 0 < -4
> 4
Changes
100 200 50 km
Universal Transverse Mercator projection
1993 1996 1994
Digital Number
High : 63 Low : 0 Universal Transverse Mercator projection
10 20 kmFigure 4: Genocide event: Rwanda
Figure 4. Genocide Event: Rwanda
26 26.5 27 27.5
Actual ln(GDP) ln(GDP) predicted by lights
1992 1994 1996 1998 2000 2002 2004 2006 2008
Year
−1 −0.5 0.5
ln(GDP) net of country and year fixed effects ln(lights/area) net of country and year fixed effects Panel A. GDP versus lights: overall panel
−1 −0.5 0.5 1
Bandwidth = 0.8
Table 2—Baseline Results for the World: 1992–2008; Growth in Real GDP (constant LCU) ln (GDP) ln (GDP) ln (GDP) ln (GDP) ln (GDP) ln (GDP) ln (GDP) ln (GDP) (1) (2) (3) (4) (5) (6) (7) (8) ln (lights/area) 0.277*** 0.2618*** 0.2662*** 0.286*** 0.282*** 0.166*** 0.284*** [0.031] [0.0344] [0.0314] [0.034] [0.046] [0.051] [0.030] ln (lights/area) sq. −0.0058 [0.0060] ln (count 0.0115* top-coded + 1) [0.0059] ln (unlit) −0.0124 [0.0122] Spatial Gini 0.165 [0.194] ln (KWH) 0.283*** 0.201*** [0.047] [0.041] Observations 3,015 3,015 3,015 3,015 1,853 1,853 1,853 3,015 Countries 188 188 188 188 128 128 128 188 (Within country) R2 0.769 0.769 0.770 0.769 0.757 0.767 0.782 0.770 notes: All specifjcations include country and year fjxed effects. Column 8 excludes regions with gas fmares. Robust standard errors, clustered by country, are in brackets. *** Signifjcant at the 1 percent level. ** Signifjcant at the 5 percent level. * Signifjcant at the 10 percent level.
Table 3—Lights Up/Down, Time Trend, Long Difference Fixed effects Country time trend Demeaned plus/minus Long difference Long difference (1) (2) (3) (4) (5) ln (lights/area) 0.277*** 0.180*** 0.320*** 0.302*** [0.031] [0.036] [0.037] [0.037] ⎮ + ∆ ln (lights/area)⎮ 0.274*** [0.039] ⎮ − ∆ ln(lights/area)⎮ −0.279*** [0.056] ln (top-coded + 1) 0.021 [0.015] ln (unlit) −0.0077 [0.0242] Time effects Yes Yes In demean No No Country effects Yes Yes In demean No No Observations 3,015 3,015 3,015 170 170 Countries 188 188 188 170 170 (Within country) R2 0.769 0.904 0.209 0.279 0.288 notes: Robust standard errors (clustered by country except in column 2) in brackets. In columns 4 and 5, long dif- ferences are formed by averaging the fjrst and last two years of levels data. *** Signifjcant at the 1 percent level. ** Signifjcant at the 5 percent level. * Signifjcant at the 10 percent level.