
SLIDE 1
Figure 1 a. The location of Reay Creek and Reay Creek Pond on northern Saanich Peninsula
Victoria Airport Sidney Bazan Bay Reay Creek Pond
Reay Creek & Pond
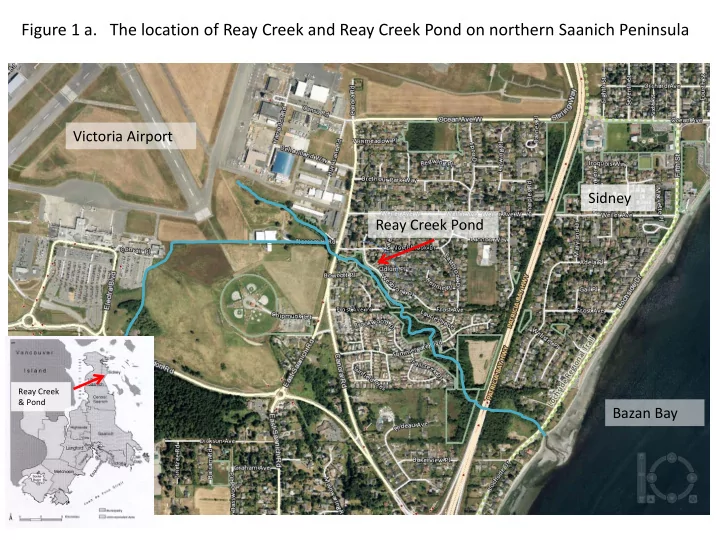
Figure 1 a. The location of Reay Creek and Reay Creek Pond on - - PowerPoint PPT Presentation
Figure 1 a. The location of Reay Creek and Reay Creek Pond on northern Saanich Peninsula Victoria Airport Sidney Reay Creek Pond Reay Creek & Pond Bazan Bay Figure 1 b. Reay Creek & Pond showing Core Locations 2 1 Reay Creek
Reay Creek & Pond
1 2
Reay Creek & Pond
200 400 600 800 1000 1200 0 to 0.25 0.25 to 0.5 0.5 to 0.75 0.75 to 1.00 1.00 to 1.25 1.25 to 1.5 1.5 to 1.75 Area (m2) Depth interval (m)
0.00 1.00 2.00 3.00 0.00 5.00 10.00 15.00 20.00 25.00 30.00 Ln[210Pbex] Depth (g/cm2)
0.5 1 1.5 2 2.5 3 0.00 5.00 10.00 15.00 20.00 25.00 30.00
26 cm ̶ 1934 ±5
210Pb dating results
1 Taylor, 1964. 2Turekian and Wedepohl, 1961. 3Gallagher et al., 2004.
10 20 30 40 50 60 70 10 20 30 40 50 60
200 400 600 800 1000 10 20 30 40 50 60
20 40 60 80 100 120 140 10 20 30 40 50 60
50 100 150 200 250 10 20 30 40 50 60
0.1 0.2 0.3 0.4 0.5 10 20 30 40 50 60
20 40 60 80 100 120 10 20 30 40 50 60
1Criteria for Managing Contaminated Sediments in British Columbia- Technical Appendix 2CCME Fresh Water Sediment Guidelines 3Sediment Quality Criteria: scs – sensitive contaminated sites; tcs – typical contaminated sites 4Interim Sediment Quality Guideline 5P
b bl Eff t Li it
10 20 30 40 50 60 70 1932 1952 1972 1992 2012
20 40 60 80 100 120 1932 1952 1972 1992 2012
20 40 60 80 100 120 140 1932 1952 1972 1992 2012
200 400 600 800 1000 1932 1952 1972 1992 2012
4.2 ug/g = BC FW TCS Contaminated Sediment Guideline 110 ug/g = BC FW TCS Contaminated Sediment Guideline 380 ug/g = BC FW TCS Contaminated Sediment Guideline 240 ug/g -= BC FW TCS Contaminated Sediment Guideline
10 20 30 40 50 60 70 80 Mono Di Tri Tetra Penta Hexa Hepta Octa Nona Deca %
Top Bottom "1254"
10000 20000 30000 40000 50000 60000 70000 80000 Mono Di Tri Tetra Penta Hexa Hepta Octa Nona Deca pg/g Top Bottom 10 20 30 40 50 60 70 80 Mono Di Tri Tetra Penta Hexa Hepta Octa Nona % Top Bottom "1254"
5000 10000 15000 20000 25000 30000 2,4-DiBDE 2,4'-DiBDE 2,6-DiBDE 3,3'-DiBDE 3,4-DiBDE 3,4'-DiBDE 4,4'-DiBDE 2,2',4-TriBDE 2,3',4-TriBDE 2,4,4'-TriBDE 2,4,6-TriBDE 2,4',6-TriBDE 2',3,4-TriBDE 3,3',4-TriBDE 3,4,4'-TriBDE 2,2',4,4'-TeBDE 2,2',4,5'-TeBDE 2,2',4,6'-TeBDE 2,3',4,4'-TeBDE 2,3',4',6-TeBDE 2,4,4',6-TeBDE 3,3',4,4'-TeBDE 3,3',4,5'-TeBDE 2,2',3,4,4'-PeBDE 2,2',4,4',5-PeBDE 2,2',4,4',6-PeBDE 2,3,3',4,4'-PeBDE 2,3,4,5,6-PeBDE 2,3',4,4',6-PeBDE 2,3',4,5,5'-PeBDE 3,3',4,4',5-PeBDE 2,2',3,3',4,4'-HxBDE 2,2',3,4,4',5'-HxBDE 2,2',3,4,4',6'-HxBDE 2,2',4,4',5,5'-HxBDE 2,2',4,4',5,6'-HxBDE 2,2',4,4',6,6'-HxBDE 2,3,4,4',5,6-HxBDE 2,2',3,4,4',5,6-HpBDE 2,2',3,4,4',5',6-HpBDE 2,3,3',4,4',5,6-HpBDE 2,2',3,4,4',5,5',6-OcBDE 2,2',3,3',4,4',5,5',6-NoBDE 2,2',3,3',4,4',5,6,6'-NoBDE 2,2',3,3',4,5,5',6,6'-NoBDE 2,2',3,3',4,4',5,5',6,6'-DeBDE
Top Bottom
500 1000 1500 2000 2500 3000 3500 4000 PAHs (ng/g)
top Bottom
500 1000 1500 2000 2500 3000 3500 4000 ng/g
top Bottom
500 1000 1500 2000 2500 3000 3500 4000 Top Bottom
5 10 15 20 25 2,4'-DDD 4,4'-DDD 2,4'-DDE 4,4'-DDE 2,4'-DDT 4,4'-DDT [DDT] (ng/g)
Top Bottom
5 10 15 20 25 2,4'-DDD 4,4'-DDD 2,4'-DDE 4,4'-DDE 2,4'-DDT 4,4'-DDT ng/g Top Bottom
0.5 1 1.5 2 2.5 3 3.5 4 4.5 5 ng/g Top Bottom
1Sediment Quality Criteria – sensitive contaminated sites, Criteria for Managing
Contaminated sediments in British Columbia, Technical Appendix
2Interim Sediment Quality Guideline, CCME FW Sediment Guidelines 3Probable Effects Limit, CCME FW Sediment Guidelines
1Burden is the net amount of contaminant, above background or “crustal” concentrations