
SLIDE 1
Adding value through geology and exploration
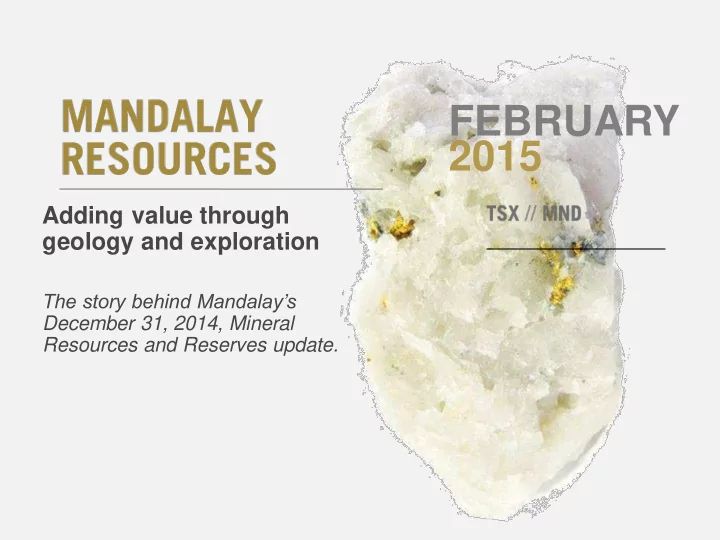
The story behind Mandalay’s December 31, 2014, Mineral Resources and Reserves update.
FEBRUARY 2015 Adding value through geology and exploration The - - PowerPoint PPT Presentation
FEBRUARY 2015 Adding value through geology and exploration The story behind Mandalays December 31, 2014, Mineral Resources and Reserves update. Forward-looking Statements This presentation contains "forward-looking statements"
The story behind Mandalay’s December 31, 2014, Mineral Resources and Reserves update.
This presentation contains "forward-looking statements" within the meaning of applicable securities laws, including statements relating to life of mine production plans and exploration plans and the growth and strategy of Mandalay. Readers are cautioned not to place undue reliance on forward-looking statements. Actual results and developments may differ materially from those contemplated by these statements depending on, among other things, that exploration results at Cerro Bayo, Costerfield, Challacollo and Bjorkdal may not meet management’s expectations, that Cerro Bayo, Costerfield and Bjorkdal capital, production and operating cost results may not meet current plans and changes in commodity prices and general market and economic conditions. The factors identified above are not intended to represent a complete list of the factors that could affect Mandalay. Although Mandalay has attempted to identify important factors that could cause actual actions, events or results to differ materially from those described in forward-looking statements, there may be other factors that cause actions, events or results not to be as anticipated, estimated or intended. There can be no assurance that forward-looking statements will prove to be accurate, as actual results and future events could differ materially from those anticipated in such statements. Accordingly, readers should not place undue reliance on forward- looking statements.
Quality control and assurance programs are implemented in line with the standards of National Instrument 43-101. The exploration programs at Costerfield and Bjorkdal are supervised by Chris Gregory (Member, Australian Institute of Geoscientists accredited Chartered Professional (Mining)) a Qualified Person as defined under National Instrument 43-101. Mr. Gregory regularly visits Costerfield and Bjorkdal and supervises the collection and interpretation of scientific and technical information contained in this presentation. He has read and approved the sections of this presentation on Costerfield and Bjorkdal. The exploration program on the Cerro Bayo project is supervised by Scott Manske (an Oregon registered Professional Geologist, a “Qualified Person” as defined by NI 43-101). Mr. Manske visits the Cerro Bayo project often and supervises the collection and interpretation of scientific and technical information contained in this presentation. He has read and approved the section of this presentation on Cerro Bayo contained in this release. The exploration program on the Challacollo project is supervised by Ronald Luethe (Member: American Institute of Professional Geologists and an Idaho Registered Professional Geologist), and a Qualified Person as defined under National Instrument 43-101. Mr. Luethe visits the Challacollo project often, supervises the collection and interpretation of scientific and technical information contained in this presentation. He has read and approved the section of this presentation on Challacollo.
times during the period 2009-2015 and has supervised the preparation of this presentation.
2
3
To create exceptional shareholder value through the acquisition of undervalued assets that can rapidly become cash generative, self-fund exploration, establish and maintain high operating margins and return cash to shareholders within a planned period of time. Mandalay is committed to operating safely and in an environmentally responsible manner, while developing a high level of community and employee engagement.
– Non-existent or non-compliant resource & reserve estimations – Poor reconciliations between reserves and production – Poor communications between geologists and engineers – Short mine lives or poor capacity utilization based on existing reserves – Inadequate geologic understanding to support effective exploration – Unsupported geologic hypotheses– “myths”– that could be misleading – Underinvestment in exploration – The more of these we see, the greater the potential upside if we can propose improvement hypotheses
– If none or few of these exist, likely to be little upside in the way of geology/exploration/reserves
metallurgy, costs, financial structure), we will walk
4
– Secure the base case with an independent, Ni 43-101-compliant resource and reserve estimation
– Invest in basic geology & ore-forming hypotheses to support exploration
– Organize exploration- Portfolio of stage-gated, hypothesis-testing projects – Infill and conversion projects to reach & maintain >4-5 yr mine life – Extension and bounding projects to enlarge positive target tests and upgrade to Inferred Resource – New target testing projects demonstrate target potential – Fund exploration from site cash flow– limits risk of overspending
5
6
Costerfield, Australia Producing Au-Sb
X X
Cerro Bayo, Chile Producing Ag-Au Bjorkdal, Sweden Producing Au
X X Challacollo, Chile
Feasibility Ag-Au
X X
Lupin, Canada Past Au Producer; sale in process La Quebrada, Chile Cu-Ag resource; sale in process
15,854 63,351 107,941 126,908 253,796 520,175 633,000 771,500 1,123,367
200,000 400,000 600,000 800,000 1,000,000 1,200,000 50,000 100,000 150,000 200,000 250,000 300,000
2010 2011 2012 2013 2014 2015 Oz Au Eq. Year-End Reserves Oz Au Eq. Annual Production
7
(4) Price assumptions for calculating gold eq.oz reserves were based on each year’s metal price documented in the Technical Reports.; 2014 price assumptions were $1,200 Au, $20 Ag
and $10,000 Sb
(5) Price assumptions for calculating gold eq.oz production were based on each period’s average spot metal price.
Significant increase in average mine life;
in Reserves
Reserves4 Production5
154,810 167,000 – 185,000 E
2014 2013 Au Ag Sb Au Ag Sb (cont. oz) (cont. oz) (cont. t) (cont. oz) (cont. oz) (cont. t) Proven 53,000 2,513,000 4,400 61,000 4,705,000 3,000 Probable 656,000 14,549,000 11,200 240,000 13,197,000 12,000 Proven + Probable 709,000 17,062,000 15,600 301,000 17,902,000 15,000
Resources1 Reserves2
Au Ag Sb Au Ag Sb Cu (cont.
(cont.
(cont. t) (cont.
(cont.
(cont. t) (cont. lb) Measured 96,000 3,143,000 9,600 99,000 5,596,000 8,000
1,039,000 47,622,000 26,300 367,000 35,372,000 22,000 459,000,000 Measured + Indicated 1,135,000 50,765,000 35,900 466,000 40,968,000 30,000 459,000,000 Inferred 221,000 11,003,000 13,700 221,000 30,280,000 22,000 13,000,000
2013 2014
(1)The end-of-year 2014 Mineral Resources summarized
here refer to the Mandalay press release dated February 17, 2015, based on independent estimates by Roscoe Postle Associates (for Cerro Bayo and Bjorkdal), SRK (for Costerfield) and Mining Plus (for Challacollo). Full NI 43- 101 Technical Reports will be filed on www.sedar.com within 45 days of February 17, 2015. Details of tonnes and grade of material in each category at each property are given in later slides of this presentation.
(2)The end-of-year 2014 Mineral Reserves summarized
here refer to the Mandalay press release dated February 17, 2015, based on independent estimates by Roscoe Postle Associates (for Cerro Bayo and Bjorkdal), SRK (for Costerfield) and Mining Plus (for Challacollo). Full NI 43- 101 Technical Reports will be filed on www.sedar.com within 45 days of February 17, 2015. Details of tonnes and grade of material in each category at each property are given in later slides of this presentation.
M&I Resources(1) P&P Reserves(1)
25,000,000 50,000,000 75,000,000 2010 2011 2012 2013 2014
Ag (cont. oz)
200,000 400,000 600,000 800,000 1,000,000 1,200,000 2010 2011 2012 2013 2014
Au (cont. oz)
10,000 20,000 30,000 40,000 2010 2011 2012 2013 2014
Sb (cont. t)
(1) The end-of-year 2014 Mineral Resources and Reserves summarized in these histograms refer to the Mandalay press release dated February 17, 2015, based on independent estimates by Roscoe Postle Associates (for Cerro Bayo and Bjorkdal), SRK (for Costerfield) and Mining Plus (for Challacollo). Full NI 43-101 Technical Reports will be filed on www.sedar.com within 45 days of February 17, 2015. Details of tonnes and grade of material in each category at each property given in later slides of this presentation. 5,000,000 10,000,000 15,000,000 20,000,000 2010 2011 2012 2013 2014
Ag (cont. oz)
200,000 400,000 600,000 800,000 2010 2011 2012 2013 2014
Au (cont. oz)
5,000 10,000 15,000 20,000 2010 2011 2012 2013 2014
Sb (cont. t)
Inferred Resources(1)
10,000,000 20,000,000 30,000,000 40,000,000 2010 2011 2012 2013 2014
Ag (cont. oz)
50,000 100,000 150,000 200,000 250,000 2010 2011 2012 2013 2014
Au (cont. oz)
10,000 20,000 30,000 2010 2011 2012 2013 2014
Sb (cont. t)
9 Rönberget
Björkdal Open pit and underground mine
Nylands Storheden
2km Skellefteӓ
10
Björkdal Resources Measure d Au (cont. oz) Indicated Au (cont. oz) Measured + Indicated Au (cont. oz) Inferred Au (cont. oz) Open Pit 2,746 229,611 232,357 111,907 Underground 12,624 765,319 777,944 640,972 Totals 15,370 994,930 1,010,301 752,879
Historical M&I 1,010,000
QA/QC on mine sampling failed
tonnes much lower– tight wireframing vs. uncon- strained search ellipses
with wire-framing, con- fidence much higher
Tonnes (t) Gold (g/t) Gold (cont. oz) Measured Indicated 2,481,000 1.65 132,000 Measured + Indicated 2,481,000 1.65 132,000 Inferred 790,000 1.1 29,000 Measured -
3,654,000 4.17 490,000 Measured + Indicated 3,654,000 4.17 490,000 Inferred 410,000 3.4 44,000 Measured -
1,000,000 0.5 16,000 Measured + Indicated 1,000,000 0.5 16,000 Inferred
7,135,000 2.78 638,000 Measured + Indicated 7,135,000 2.78 638,000 Inferred 1,200,000 1.9 73,000 Total Open Pit Underground Stockpile
(1) The Mineral Resource Estimate was carried out under the supervision of Ian T. Blakley, P.Geo., an employee of Roscoe Postle
Associates, independent of Mandalay Resources Corporation, and a "Qualified Person" for the purpose of National Instrument 43-101. The full Technical Report will be filed on www.sedar.com within 45 days of the original Feb 17, 2015 press release announcing the work.
See appendix for footnotes to table
11
Bjorkdal Historical Open-Pit Reserves Tonnes (1,000’s) Grade (g/t) Ounces Proven 49.6 1.48 2,366 Probable 5,454.4 1.04 182,858 Total 5,504.0 1.05 185,224 Bjorkdal Historical Underground Reserves Tonnes (1000’s) Grade (g/t) Ounces Proven 36.2 2.02 2,357 Probable 2,054.7 2.07 136,732 Total 2,090.9 2.07 139,089
Historical P&P 324,000 oz Au
Proven
better mine plan
(1) The Mineral Reserves Estimate was carried out under the supervision of Thomas H. A. Healy, P.Eng., an employee of Roscoe Postle
Associates, independent of Mandalay Resources Corporation, and a "Qualified Person" for the purpose of National Instrument 43-101. The full Technical Report will be filed on www.sedar.com within 45 days of the original Feb 17, 2015 press release announcing the work.
See appendix for footnotes to table
12
275 underground wireframes 104 open pit wireframes
13
marble and meta- volcanic and sedimentary rocks
away from veins (arising from old study; justified large underground openings)
Coarse free gold in sheeted quartz veins
Source: Elgin company disclosure
“Thrust” Veins fill fractures in brittle granodiorite; attenuated in overlying ductile marble “Thrust”
14
15
5 km
Björkdal mine
Open-pit outline
Granitic instrusive ‘Marble’ Volcano-clastics Mafic intrusive Volcanics Sedimentary succession (mudstone and sandstone) Granitic instrusive Metasomatised country-rock Volcano- clastics
B B’ A A’
17
Strike of high- grade trends Strike of mined veins
gold concentrations that are not defined by actual vein orientations
interpretation of existing data-sets to build more effective grade control model and exploration hypotheses (in progress)
(Leachwell; in progress)
– Verify block model and estimation methods with detailed sampling, then mine for reconciliation – Feed back on criteria for Measured vs Indicated vs Inferred and grade control
– Mine selected RPA stopes to plan, test ability to deliver grade
gain in P&P this year
18
– High density diamond drilling programme; includes the use of fully oriented core and multi- element geochemical assaying – Will provide high-density geological data that is required to inform and refine exploration strategies, continued resource growth, mine planning/production efficiencies and metallurgical/milling improvements
19
20 Chile Argentina
CB Plant CB Plant Laguna Verde
Chile Argentina
Chile Chico Cerro Bayo
Consessions Boundary 10 KM Scale
Chile
5,000,000 10,000,000 15,000,000 20,000,000 25,000,000 30,000,000 35,000,000 2010 2011 2012 2013 2014
OZS Ag
END OF YEAR MEASURED PLUS INDICATED RESOURCES
Cerro Bayo Cumulative M+I Resource Additions & Depletion (Ag Ozs)
CUMULATIVE DEPLETION Dagny Dalila Bianca Fabiola Yasna Delia NW Delia SE Trinidad Coyita Marcela Sur Raul
Tonnes Au Grade Ag Grade Au Ag (t) (g/t) (g/t) (cont.
(cont.
Measured 310,000 2.63 316 26,000 3,143,000 Indicated 1,685,000 3.28 323 178,000 17,525,000 Measured + Indicated 1,995,000 3.18 322 204,000 20,668,000 Inferred 585,000 2.26 218 43,000 4,112,000
Resources(1) Reserves(2)
(1) The Independent Qualified Person for the Cerro Bayo Mineral Resource estimate is Rosmery Julia Cardenas Barzola, MAusIMM (CP Geo), RPA, who is a Qualified Person as defined by National Instrument 43-101 (“NI 43-101”). The full Technical Report supporting this estimate will filed on www.sedar.com within 45 days of the original February 17, 2015, press release. (2) The Independent Qualified Person for the Cerro Bayo Mineral Reserve estimate is Normand Lecuyer, P. Eng., RPA, who is a Qualified Person as defined by NI 43-101. The full Technical Report supporting this estimate will filed on www.sedar.com within 45 days of the original February 17, 2015, press release.
See appendix for full footnotes to tables
– Initial “inherited” reserves on developed veins approx. doubled due to (a) recognition of overly-conservative manual oreshoot boundaries in previous owner’s estimate, and (b) 61,500 m of additional drilling by MND.
– MND drilling further increases exploration reserves by (a) adding to existing reserve veins Dagny, Fabiola, and Delia, and (b) extending and converting I&I resources along veins not considered minable by previous owner, e.g., the Coyita, Dalila, Trinidad, Raul, Marcela, and Bianca lodes.
– MND drilling proves extension of Laguna Verde veins under the lake in 2013. – Step-out and infill drilling converts Coyita and Yasna extensions to reserves in 2014. Mineralized shoots remain open.
22
23
24
25
Drilling 2014; see Appendix for assay data
26
Drilling 2014; see Appendix for assay data
27
Drilling 2014; see appendix for assay data
28
Drilling 2014; see appendix for assay data
29
30
31
32
33
34
35
36
37
The story behind Mandalay’s December 31, 2014, Mineral Resources and Reserves update.
Recent Tenement Map
Resource(1) Category Tonnes (t) Au Grade (g/t) Sb Grade (%) Au (oz) Sb (t) Measured 213,000 9.8 4.5 67,000 9,600 Indicated 786,000 6.9 3.3 175,000 26,300 Measured + Indicated 999,000 7.5 3.6 242,000 35,900 Inferred 519,000 5.3 2.6 89,000 13,700 Reserve(2) Category Tonnes (t) Au Grade (g/t) Sb Grade (%) Au (oz) Sb (t) Proven 98,000 10.4 4.5 32,000 4,400 Probable 333,000 7.4 3.3 80,000 11,200 Proven + Probable 431,000 8.1 3.6 112,000 15,600 See appendix for full footnotes to tables
(1)Danny Kentwell MSc, BAppSc, FAusIMM, fulltime employee of SRK Consulting is a qualified person under NI 43-101 and is the Competent Person
for the Brunswick Mineral Resource Estimate.
(2)The Mineral Reserve estimate was prepared by Shannon Green P.Eng., BEng, MAusIMM who is a full time employee of Mandalay Resources and
was independently verified by Peter Fairfield, FAusIMM, fulltime employee of SRK Consulting who is a qualified person under NI 43-101.
2010
knowledge and understanding through re-interpretation of all available data. 2011
Deposit.
2012
2013
Economic Assessment.
2014
depth.
40
41
Current Resource and Reserves with resource expansion of Cuffley continuing in 2015. Prospective regional targets within our exploration tenements Comparison to Known Costerfield West Augusta + Cuffley
Geochem anomaly High Au-Sb High Sb-Au Strike Length 1500m 1700m AuEq Oz Contained 700,000
(Deposit Potential)
875,000
(M@I + Mined)
42
Intercept of potentially economic tenor below King Cobra fault
43
44
45
Mineralisation Identified in 2014 – Below King Cobra
Untested potential to the west of current mining operations between major regional faults and below the King Cobra Fault.
Untested potential
Cuffley inferred resource (June 2015)
below the King Cobra Fault and in the Adder Fault ‘panels’
mineralisation within the favourable structural setting between the Adder and King Cobra faults
discovery
46
47
PICA
10 Km
Iquique Antofagasta
48
since purchase = 22.1 Moz;
spend since purchase =$2.03 M
added to M&I since purchase = $0.09/oz Ag
Measured
4,700,000 0.32 200 49,000 30,097,000 Measured + Indicated 4,700,000 0.32 200 49,000 30,097,000 Inferred 1,600,000 0.31 134 16,000 6,891,000 Tonnes (t) Au (cont. oz) Ag (cont. oz) Category Au Grade (g/t) Ag Grade (g/t)
See appendix for full footnotes to tables
(1) The Mineral Resource estimate was supervised by Michael Collins, P.Geo., who is a full time
employee of Mining Plus and a Qualified Person under NI 43-101.
– In-fill drilling converted Lolon resources from Inferred to Indicated and intersected parallel vein with similar grades and widths (Lolon East). Lolon resource still open at depth although vein narrows to 2-3 m true thickness. – Detailed mapping, sampling and step-out drilling confirmed that Lolon mineralization extends at least 600 m south and 300 m north of current resource. – Initial exploration drill holes intersected significant mineralization in the Lucy vein and and high-level geochemistry indicative of deeper silver mineralization in the Millsite vein.
49
Short Hole
50
200 m Fault Gap
OPEN OPEN OPEN
51
Millsite Vein Lucy Vein
Detailed Mapping
(target: add 2.0 Moz Ag to Indicated Resource).
(target: add 1.6 Moz Ag to Indicated Resource).
(target: add 2.5 Moz Ag to indicated resource).
refining structural setting of potential resources.
potential ore shoots in known veins, 2) concealed veins under cover and 3) potential covered porphyry mineralization to east under gravels.
52
53
1. Mineral Resources estimated as of December 31, 2014, and depleted for production through December 31, 2014. 2. Canadian Institute of Mining (“CIM”) standards were followed for estimating Mineral Resources. 3. Mineral Resources are inclusive of Mineral Reserves. 4. Totals may appear different from the sum of their components due to rounding. 5. Mineral Resources are estimated using an average gold price of $1,400 per ounce. 6. Bulk density is 2.71 t/m3. 7. High gold assays were capped to 20 g/t Au for open pit and 80 g/t Au for underground. 8. Interpolation was by inverse distance cubed utilizing diamond drill and reverse circulation samples 9. Open Pit Mineral Resources are estimated at a cut-off grade of 0.35 g/t Au, constrained by the pit design and the 2014 Year End Open Pit Digital Terrain Model. 10. Underground Mineral Resources are estimated at a cut-off grade of 1.10 g/t Au. 11. A minimum mining width of approximately two m was used to interpret veins using diamond drill, reverse circulation, and underground chip sampling. 12. Reported Mineral Resources are exclusive of previously mined underground development and stopes. 13. Stockpile Mineral Resources are estimated at a cut-off grade of 0.30 g/t Au and are based upon historical estimates supplemented by production data. 14. The Mineral Resource Estimate was carried out under the supervision of Ian T. Blakley, P.Geo., an employee of RPA and independent of Mandalay Resources Corporation, is a "Qualified Person" for the purpose of National Instrument 43-101.
54
1. Mineral Resources estimated as of December 31, 2014, and depleted for production through December 31, 2014. 2. Canadian Institute of Mining (“CIM”) standards were followed for estimating Mineral Reserve. 3. Mineral Reserves are estimated at a cut-off grades of 0.4 g/t Au for open pit, 1.3 g/t Au for underground, and 0.3 g/t Au for stockpile material. 4. Mineral Reserves are estimated using an average long-term gold price of US$1,200 per ounce. 5. An effective underground minimum mining width of 3.0 m, including 0.5 m dilution on stope footwall and 0.5 m dilution on stope hanging wall. 6. Underground Mineral Reserves include mining extraction factors of 95%, 100% and 75% for stoping, on-vein ore mining and pillar recovery respectively 7. Open pit Mineral Reserves include 40% dilution and 20% mining loss factors. 8. Bulk density is 2.71 t/m3. 9. Numbers may not add due to rounding. 10. The Mineral Reserve Estimate was carried out under the supervision of Thomas H. A. Healy, P.Eng., an employee of RPA and independent of Mandalay Resources Corporation. Mr. Healy is a "Qualified Person" for the purpose of National Instrument 43-101.
1. Mineral Resources estimated as of December 31, 2014, and depleted for production through December 31, 2014. 2. Canadian Institute of Mining (“CIM”) standards were followed for estimating Mineral Resources. 3. Mineral Resources are inclusive of Mineral Reserves. 4. Totals may appear different from the sum of their components due to rounding. 5. Mineral Resources are estimated at a cut-off grade of 150 g/t AgEq. AgEq is calculated using the formula AgEq= Ag + (Au x 59.69) where Ag and Au are in grams per tonne. 6. Wireframe vein models were used to constrain the Cerro Bayo Resources. 7. Mineral Resources were estimated using US$1,400 per oz. Au and US$24 per oz. Ag 8. A minimum vein width of 1.2 m was used. 9. A bulk density of 2.63 t/m3 was used. 10. No legal, political, environmental, or other risks are known to the above referenced Qualified Person that could materially affect the potential development of the mineral resources reported above. 11. The Independent Qualified Person for the Cerro Bayo Mineral Resource estimate is Rosmery Julia Cardenas Barzola, MAusIMM (CP Geo), RPA, who is a Qualified Person as defined by National Instrument 43-101 (“NI 43-101”).
55
1. Mineral Reserve estimated as of December 31, 2014, and depleted for production through December 31, 2014. 2. CIM standards were followed for estimating Mineral Reserves. 3. Totals may appear different from the sum of their components due to rounding. 4. Mineral Reserves are estimated at a cut-off grade of 184 g/t AgEq (silver equivalent). AgEq is calculated using the formula AgEq= Ag + (Au x 61.66) where Ag and Au are in grams per tonne. Metal prices for determining cut-off grades were US$1,200/oz Au and US$20/oz Ag. 5. Profitability of Mineral Reserves were estimated using a long-term gold price of US$1,200 per ounce and a long-term silver price of US$20 per ounce. 6. Veins are diluted to 2.4 m minimum mining width. 7. A bulk density of 2.63 t/m3 was used. 8. Dilution grades vary by vein. 9. No legal, political, environmental, or other risks are known to the above referenced Qualified Person that could materially affect the potential development of the mineral reserves reported above.
Person as defined by NI 43-101.
Hole_ID Hole Compl. Date Hole Total Depth (m) Intercept UTM_E Intercept UTM_N Intercept Elevation (m) From m) To (m) Intercept Length (m) Intercept True Width (m) Gold Grade (g/t) Silver Grade (g/t) DLV15-001 1/14/2015 318.20 272297.29 4840678.9 10.09 288.15 289.95 1.8 1.18 5.07 270 DLV14-019 6/2/2014 647.55 272300.76 4840690.03
350.5 353.62 3.12 2.1 2.04 30 DLV14-021 6/6/2014 452.20 272104.44 4840959.19 113.69 372.4 376.85 4.45 3.04 0.85 183 DLV14-024 6/17/2014 371.50 272141.16 4840912.54 82.76 344.75 347.06 2.31 1.72 0.75 221 DLV14-023 6/20/2014 341.30 272291.6 4840609.07 85.02 262.36 264.5 2.14 1.71 0.51 38 DLV14-025 6/24/2014 311.20 272184.46 4840840.32 115.7 254.62 256.9 2.28 1.79 32.97 1821 DLV14-027 6/25/2014 300.45 272209.27 4840799.61 58.97 250.73 256 5.27 3.98 8.87 282 DLV14-029 7/1/2014 296.85 272177.86 4840866.86 68.65 264.1 267.8 3.7 2.5 4.53 282 DLV14-033 8/1/2014 275.45 272147.38 4840873.06 127.5 247.27 253.87 6.6 4.79 6.29 403 DLV14-032 8/10/2014 293.40 271900.57 4841205.8 147.33 274.46 275.9 1.44 1.19 1.92 990 DLV14-038 8/26/2014 326.00 271892.74 4841231.7 113.35 276 277.15 1.15 0.97 1.95 610 DLV14-041 9/5/2014 386.00 272158.8 4840921.03 51.84 348.62 353.4 4.78 3.36 3.81 1102 DLV14-039 9/17/2014 335.15 271951.3 4841131.12 170.32 318.05 322.8 4.75 3.23 0.21 123 DLV14-043 9/23/2014 399.95 272111.77 4840958.42 84.43 378.18 380.45 2.27 1.6 18.09 1048 DLV14-044 9/29/2014 345.00 271922.28 4841209.89 98.4 299 302.8 3.8 2.98 0.51 88 DLV14-042 10/4/2014 320.25 272179.14 4840887.48 35.43 292.25 294.9 2.65 1.65 4.99 2346 DLV14-046 10/7/2014 460.40 272129.39 4840963.7 69.46 373.18 375.03 1.85 1.24 2.33 267 DLV14-047 10/14/2014 255.15 272227.75 4840749.94 71.44 243.7 246.7 3 2.41 26.55 842 DLV14-050 10/22/2014 414.55 272130.27 4840966.17 29.91 393.97 396.5 2.53 1.63 4.84 1616 DLV14-051 10/23/2014 263.50 272245.57 4840751.62 51.21 239.33 244.62 5.29 2.86 11.8 651 DLV14-049 10/31/2014 389.45 271978.12 4841167.17 93.98 376.62 379.7 3.08 2.04 0.08 13 DLV14-053 11/4/2014 245.50 272242.76 4840716.95 69.92 226.35 226.74 0.39 0.25 3.63 1233 DLV14-054 NO INTERCEPT DLV14-056 11/21/2014 238.85 272209.28 4840736.3 105.93 214.08 216.48 2.4 1.76 0.57 151 DLV14-058 11/27/2014 290.50 272170.95 4840925.33 2.27 373.48 377.42 3.94 2.63 2.33 36 DLV14-059 12/1/2014 162.05 272268.49 4840720.14 23.12 259.09 260.74 1.65 0.86 3.18 1716 DLV14-060 12/14/2014 320.50 272250.22 4840772.37 9.27 278.78 283.15 4.37 1.97 1.07 104 DLV14-055 12/19/2014 429.50 272017.38 4841095.38 124.51 419.37 421.33 1.96 1.05 3.65 921 DLV14-061 1/2/2015 346.85 272273.36 4840736.98
327.68 332.4 4.72 2.68 1.51 36 DLV14-063 1/7/2015 454.85 272132.68 4840992.16
426.17 428.87 2.7 1.55 2.23 364
56
Hole_ID Hole Compl. Date Hole Total Depth (m) Intercept UTM_E Intercept UTM_N Intercept Elevation (m) From m) To (m) Intercept Length (m) Intercept True Width (m) Gold Grade (g/t) Silver Grade (g/t) DLV14-022 17-06-2014 465.05 272054.5 4840617.3
386.92 387.54 0.62 0.25 1.96 180 DLV14-026 29-06-2014 485.70 271717.93 4840952.24 78.83 384.43 387.45 3.02 1.3 0.93 44 DLV14-030 27-07-2014 479.85 271861.45 4840848.68 100.02 463.41 468.25 4.84 4.19 0.73 107 DLV14-031 20-07-2014 356.20 271679.07 4841061.1 126.02 310.75 311.72 0.97 0.68 0.46 129 DLV14-036 07-08-2014 399.90 271704.22 4840989.16 115.18 346.7 347.6 0.9 0.45 0.71 258 DLV14-037 26-08-2014 542.25 271762.48 4840909.34 67 525.25 528.35 3.1 2.31 1.14 118 DLV14-045 13-10-2014 462.15 271835.65 4840811.05 36.2 430.15 430.95 0.9 0.58 4.3 650
57
Hole_ID Hole Compl. Date Hole Total Depth (m) Intercept UTM_E Intercept UTM_N Intercept Elevation (m) From m) To (m) Intercept Length (m) Intercept True Width (m) Gold Grade (g/t) Silver Grade (g/t) DLV14-030 27-07-2014
479.85
271676.87 4840762.87 90.96 261.45 262.45 1 0.91 0.7 73 DLV14-035 26-08-2014
601.60
271722.54 4840712.44 91.52 287.45 287.75 0.30 0.23 3.42 813 DLV14-040 21-09-2014
511.65
271666.69 4840799.27 90.58 272.29 272.51 0.22 0.2 9.42 4176 DLV14-052 15-11-2014 649.90 271840.09 4840616.2 36.26 470.47 470.81 0.34 0.33 5.13 589
Hole_ID Hole Compl. Date Hole Total Depth (m) Intercept UTM_E Intercept UTM_N Intercept Elevation (m) From m) To (m) Intercept Length (m) Intercept True Width (m) Gold Grade (g/t) Silver Grade (g/t) DLV14-019 02-06-2014 647.55 272227.09 4840582.46
588.9 589.2 0.3 0.18 2.86 66 DLV14-022 17-06-2014 465.05 272130.94 4840641.72 70.1 268.38 268.7 0.32 0.21 2.99 101
1. Mineral Resources estimated as of December 31, 2014, and depleted for production through December 31, 2014. 2. Mineral Resources stated according to CIM guidelines and include Mineral Reserves. 3. Tonnes and contained gold (oz) are rounded to the nearest thousand; contained antimony (t) rounded to nearest hundred. 4. Totals may appear different from the sum of their components due to rounding. 5. A 3.8 g/t Au Equivalent (AuEq) cut-off grade over a minimum mining width of 1.2 m is applied where AuEq is calculated at a gold price
6. The Au Equivalent value (AuEq) is calculated using the formula: AuEq = Au g/t + 2.03 * Sb % 7. The Brunswick Mineral Resource has not been re-estimated since it was reported in Frederickson, D., 2009, Costerfield Gold and Antimony Project, Augusta and Brunswick Deposits. Frederickson Geological Solutions Pty Ltd. 8. The Brunswick resource reporting methodology has been reviewed and is now consistent with that of the Augusta and Cuffley Deposits. 9. The Mineral Resource estimation for Augusta and Cuffley deposits was performed by Chris Davis BSc, MAusIMM, who is a fulltime employee of Mandalay Resources and was independently verified by Danny Kentwell MSc, BAppSc, FAusIMM, a full-time employee of SRK Consulting who is a qualified person under NI 43-101 and is the Competent Person for the Augusta and Cuffley Mineral Resource Estimates. 10. Danny Kentwell MSc, BAppSc, FAusIMM, fulltime employee of SRK Consulting is a qualified person under NI 43-101 and is the Competent Person for the Brunswick Mineral Resource Estimate.
58
1. Mineral Reserve estimated as of December 31, 2014, and depleted for production through December 31, 2014. 2. Mineral Reserves are stated according to CIM guidelines. 3. Tonnes and contained gold (oz) are rounded to the nearest thousand; contained antimony (t) rounded to nearest hundred. 4. Totals may appear different from the sum of their components due to rounding. 5. Lodes have been diluted to a minimum mining width of 1.2 m for stoping and 1.8 m for ore development. 6. A 5.0 g/t Au Equivalent (AuEq) cut-off grade is applied. 7. Commodity prices applied are: gold price of $1,200/oz, antimony price of $10,000/t and exchange rate USD:AUD of 0.85. 8. The Au Equivalent value (AuEq) is calculated using the formula: AuEq = Au g/t + 1.97 * Sb %. 9. The Mineral Reserve is a the Measured and Indicated only Schedule, of a Life of Mine Plan that includes mining of Measured, Indicated and Inferred Resources
Resources and was independently verified by Peter Fairfield, FAusIMM, fulltime employee of SRK Consulting who is a qualified person under NI 43-101.
59
Lode Hole ID Hole Depth (m) Hole Completion Date Easting Northing RL True Width (m) Gold Grade (g/t) Antimony Grade (%) Alison South
AD102 159.6 25/08/2014 15163 4586 984 0.27 1.6 0.0 AD103 159.1 28/08/2014 15174 4655 1000 0.14 1.7 0.0 AD104 171.2 19/09/2014 15162 4728 1017 0.14 7.9 5.2 AD105W2 170 30/09/2014 15167 4769 1028 0.48 1.1 2.7 AD108 150.6 1/09/2014 15154 4638 957 0.59 41.9 2.5 AD110 180.6 4/09/2014 15152 4582 955 0.14 0.4 0.0
Cuffley Deeps
AD095 350.2 8/07/2014 15162 5254 755 0.22 0.1 0.0 AD099A 309.6 11/08/2014 15187 5060 823 0.61 6.5 0.0 AD100 406.9 19/08/2014 15166 5100 709 0.08 2.3 1.9 AD106 363.3 8/10/2014 15177 5154 822 0.21 8.1 1.7 AD107W1 276.7 27/10/2014 15181 5190 722 0.19 10.8 5.4 AD114 234.2 25/11/2014 15177 5128 846 2.55 10.0 10.8 AD113 180.3 28/11/2014 15195 5040 851 0.18 11.6 8.8 AD117 209.5 9/12/2014 15179 5084 798 0.12 27.0 8.0 AD116 218.9 4/12/2014 15171 5164 847 1.56 5.4 3.1 AD115 247.9 16/12/2014 15166 5203 843 0.51 0.8 0.3
Cuffley Main
AD098 195.6 1/07/2014 15192 5081 888 0.16 52.8 34.7 AD101 150.3 1/08/2014 15187 5139 885 0.20 3.0 6.3 AD108 150.6 1/09/2014 15144 4642 954 0.19 3.4 1.1 AD109 177.5 3/09/2014 15137 4645 895 0.26 30.3 14.8 AD115 247.9 16/12/2014 15191 5173 856 0.21 2.2 0.1
N Lode
MH371 159.3 28/07/2014 15357 4911 847 0.06 14.8 6.0 MH372 102.1 28/10/2014 15334 4816 894 0.23 115.4 53.4 MH373W2 92.8 7/11/2014 15344 4837 871 0.03 26.7 1.3 MH374 106.3 31/10/2014 15344 4861 896 0.20 12.3 3.7 MH375 120.2 4/11/2014 15350 4884 880 0.14 6.6 3.3
Below KC
AD107 413.7 23/10/2014 15153 5226 676 0.09 173.0 0.0
4.57 g/t Au and 4.11 g/t Au respectively.
under NI 43-101.
60
61
62