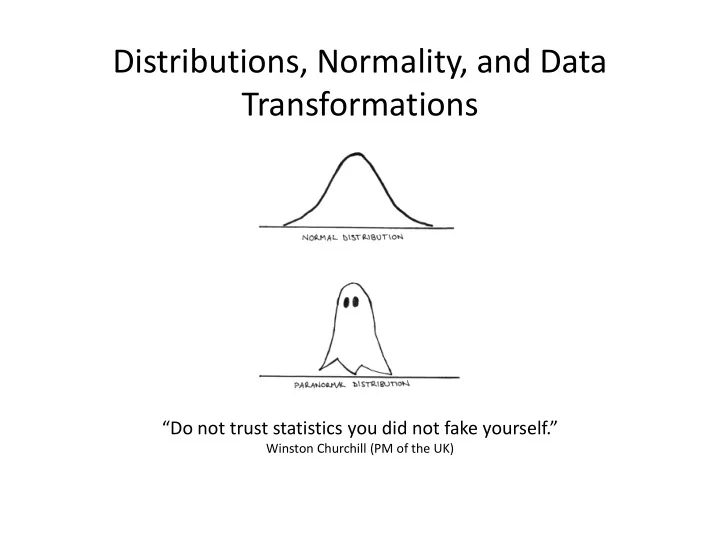

Distributions, Normality, and Data Transformations “Do not trust statistics you did not fake yourself.” Winston Churchill (PM of the UK)
Measures of Shape Skewness “asymmetry within data” Frequency Left skewed Normal Right skewed Median negatively skewed perfectly symmetric positively skewed Represented as a Mean boxplot Mode Mode Bi-Modal Frequency Two different modes Not necessarily symmetric Mean Median
Measures of Shape Kurtosis “how steep is the data peek? how fat are the distribution tails” Leptokurtic Positive (+) excess kurtosis – tall and skinny curve (sharper peak, fatter tails) Mesokurtic Zero excess kurtosis – e.g. Normal distribution Platykurtic Negative (-) excess kurtosis – flat curve (broader peak, thinner tails)
The Normal Distribution 𝑜 𝑦 𝑗 − 𝑦 2 𝑡 2 = 𝑗=1 Based on this curve: 𝑜 − 1 • 68.27% of observations are within 1 stdev of 𝑦 • 95.45% of observations are within 2 stdev of 𝑦 • 99.73% of observations are within 3 stdev of 𝑦 𝑡 2 SD = For confidence intervals: • 95% of observations are within 1.96 stdev of 𝑦
Recommend
More recommend