Data Drives Revenue. begins soon Upcoming Webinars for your - - PowerPoint PPT Presentation

data drives revenue
SMART_READER_LITE
LIVE PREVIEW

Data Drives Revenue. begins soon Upcoming Webinars for your - - PowerPoint PPT Presentation

Todays webinar Data Drives Revenue. begins soon Upcoming Webinars for your calendar: Sales Webinars: Work From Home (WFH) Strategies To Maximize Productivity (Free for RAB members) April 8 th at 11 a.m. CST Radio Listeners:


slide-1
SLIDE 1

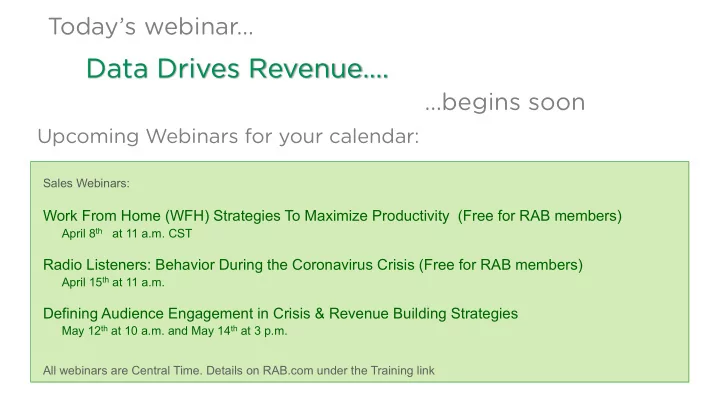
Data Drives Revenue….

Today’s webinar…

Upcoming Webinars for your calendar:

…begins soon

Sales Webinars:

Work From Home (WFH) Strategies To Maximize Productivity (Free for RAB members)

April 8th at 11 a.m. CST

Radio Listeners: Behavior During the Coronavirus Crisis (Free for RAB members)

April 15th at 11 a.m.

Defining Audience Engagement in Crisis & Revenue Building Strategies

May 12th at 10 a.m. and May 14th at 3 p.m. All webinars are Central Time. Details on RAB.com under the Training link

slide-2
SLIDE 2
slide-3
SLIDE 3

Call Kim Johnson for training support… On-Line certification classes

Discounted… Radio Marketing Professional (RMP) Certified Radio Marketing Consultant (CRMC) Certified Digital Marketing Consultant (CDMC) Certified Digital Marketing Professional Copywriter Certified Radio Sales Manager (CRSM)

SPECIAL OFFER: FREE Radio Marketing Professional (RMP) Course if registered and completed by 4/17/20 kjohnson@rab.com 972-753-6759

Gus Kim Lolly

Lolly says: “Why Haven’t you called yet? You heard him say FREE RMP right?”

slide-4
SLIDE 4
slide-5
SLIDE 5

Things You Should Know

Ø On-Demand link will be available

– Check your email – Might be in your ‘junk mail’

Ø Lines are muted

– Q & A – Type your message

Ø Problems?

RAB Member Response 800-232-3131

slide-6
SLIDE 6

Data Drives Revenue – How to Use Data in Difficult Times

slide-7
SLIDE 7

What Does Data Do?

Data is a Door Opener: It provides a valid business reason to reach out to an advertiser or prospect. Reach out with confidence and get called back. Data is Comforting: Accepted metrics provide a universal language for success. Benchmarking and aggregated insights provide the safety net of proven approaches based on category and/or region. Data is Actionable: Build a plan based on empirical results and what the audience is telling us. Know that insights driven by data will drive more response and advertiser revenue. Data Drives Revenue: Prove and improve campaign performance on a consistent basis. Knowing what works creates the confidence advertisers need to start campaigns and stay on-air long term.

Data Changes Conversations

slide-8
SLIDE 8

Opportunities Insights And Scale Data at Times In Difficult

slide-9
SLIDE 9

Aggregated Data

  • Industry Insights aggregate data from connected advertisers to

show reliable benchmarks for performance across various categories.

  • Instill immediate confidence in advertisers and prospects that their

peers are advertising successfully.

  • Show advertisers their performance relative to their industry and

market peers.

Industry Insights

slide-10
SLIDE 10

Aggregated Data

  • Show aggregated performance insights from your prospects’ industry

and market peers, allowing them to start with a pre-optimized campaign.

  • Identify opportunities for optimization by finding the top dayparts, day
  • f week, ad durations, and more on a category and market basis.
  • At a time when every dollar is precious, show advertisers that you have

the tools and business intelligence to maximize their success.

Granular Category Insights

slide-11
SLIDE 11

COVID-19 Insights

  • Weekly Web Trends Overall
  • Weekly Web Trends by Industry
  • Weekly Web Trends by Region/DMA

OVERALL

VIEW TRENDS The COVID-19 Weekly Trend Data Tool highlights industries with actionable changes in website traffic from before and after the start of mass closures and quarantines.

  • By Regions
  • Select Weeks to Compare
  • By Categories

FILTER

slide-12
SLIDE 12

COVID-19 Insights

Opportunities to Retain, Win-Back, and close New Business by identifying categories and businesses that will truly benefit from being on-air during these unprecedented times.

What does it show?

slide-13
SLIDE 13

COVID-19 Insights

How does it help?

Trend data provides a valid business reason to reach out to active advertisers for RETENTION and to inactive advertisers to WIN BACK their business. Reps can contact clients and prospects with confidence and positivity, knowing that both the advertiser and audience will benefit from them being on-air. The buttons above generate prospect lists in a rep’s dashboard for retention and outreach.

slide-14
SLIDE 14

Attribution Individual Optimization Performance &

slide-15
SLIDE 15

The Problem

“Radio doesn’t have an effectiveness problem, it has an attribution problem”

  • David Field (CEO – Entercom) – 2018 Radio Show
  • Radio Works – The medium just struggles to provide the

same level of accountability that digital has trained advertisers to expect.

  • If an advertiser is buying from 7 sources, and 6 of them

provide reporting, who gets cancelled when a CFO turns to a CMO or Marketing Director and mandates a 15% cut?

  • Accountability changes that discussion and allows Radio to

take the credit it deserves, while also providing a path to continued long-term success for the advertiser.

  • We need to shed the stigma that “Digital comes with a

report, Broadcast comes with an invoice”.

RADIO WORKS – AND YOU CAN PROVE IT

slide-16
SLIDE 16

The Solution

Attribution data provides actionable insights to consistently prove and improve campaign performance

  • Have an answer when an advertiser says “I am not sure if this

is working”.

  • Replace “I think” and “I feel” with “I KNOW”.
  • Close New Business, Extend Engagements, Cut Attrition, and

Win-Back Cancelled Advertisers.

  • Advertisers who see data*:
  • Cancel 50% Less Often
  • 65% Spend More Year-Over-Year
  • They spend 15% - 25% More

DATA DRIVES REVENUE

What is the source of these numbers? * These are results based on 10,000+ advertisers connected to the AnalyticOwl platform.

slide-17
SLIDE 17

What is Attribution?

  • In lay terms, Attribution simply means assigning a

connection between 2 events. For example: You aired ads on radio and saw more sales, appointments, web traffic, etc.

  • Digital has trained advertisers to expect this type of
  • data. It is the primary competitive advantage digital

has held over Radio for years, and is a key component in the shift in spend towards digital.

  • Web data is typically the source for accountability, and

it does Radio no favors, because it picks up the response path at the digital level, not the actual point

  • f motivation.
  • This has allowed digital sources to pull money away

from Radio, claiming full credit for the response radio drives (because Radio didn’t have a voice in the conversation).

  • No More! There are some clear and useful metrics to

show attribution for Radio.

slide-18
SLIDE 18

How Does it Work?

  • Web Lift is the most prevalent: As spots aired

there were immediate spikes in web traffic as people responded.

  • The approach is predicated on how an audience

responds to an ad: Remember a key phrase, business name, or website, then search it (or enter website directly).

  • Land on the website, where hopefully they will

then call, fill out a form, transact, etc.

  • General trends and traffic patterns show overall

impact, while granular data-views provide insights that can be used to test and optimize schedule and creative approaches.

  • Additional options, like foot traffic data, are

emerging for situations/advertisers where web lift doesn’t tell the full story.

Attribution Methods

What is Web Lift? Web lift looks at increases in website traffic in close time-proximity to the airing of ad spots. Google Analytics web tracking data is compared to the as-run spot times to look for corresponding spikes in website activity.

slide-19
SLIDE 19

Change the Focus

Focus on the Audience

  • Turn every ad into a giant focus group, with a

sample size of the entire listening audience.

  • They vote with their attention.
  • By doing so, they tell us what they what they

want to hear and when they want to hear it.

  • Test creative and schedule approaches to learn

and optimize based on what WORKS.

  • Advertisers care about business opportunities

and revenue, because revenue is real (and what they are truly after).

  • Results over Reach/Exposure!
  • Data-driven insights help not just with Radio,

but will all of their marketing efforts.

slide-20
SLIDE 20

Change the Conversation

Be an Advisor, not a “Seller”

  • Data changes the fundamental conversation between

advertiser/agency and media rep.

  • A/B Testing of creative and schedule provides a valid
  • ngoing business reason to interact and build a

relationship.

  • Insulates reps from conversations like “Radio doesn’t

work for me” or “These stations aren’t right for me”.

  • Data shows what works best and provides a path for

success.

  • There is always something positive in every data set.
  • It is the difference between calling and asking “How are

things going?” and instead calling to say “Here’s what’s working best and how we can do even better next month”.

Key Terms A/B Testing: Try multiple approaches (A and B) and see which one(s) drive the most audience response. Do more of what works best and learn, over time, what motivates the audience to do what we want them to do.

slide-21
SLIDE 21

Data Drives Revenue

Protect and Drive Revenue

Attribution data drives revenue in 4 key ways:

  • Close New Business: It is a differentiator between you

and competitors who have no accountability or ability to optimize

  • Reduce Attrition: Protect the revenue you have by

proving performance and providing ongoing

  • pportunities to improve every month, quarter, and

year.

  • Increase Share and Spend: Highlight data-driven
  • pportunities to tweak creative and schedule to lean

into what drives the most response.

  • Win-Back: Inform cancelled advertisers what they are

missing by going back in time and show response to campaigns that have ended.

LET’S LOOK AT SOME EXAMPLES

slide-22
SLIDE 22

Performance Prove

slide-23
SLIDE 23

Traffic Impact

Key Terms Radio Attributed Visits %: This is the percentage of an advertiser’s website traffic that was impacted by radio, based on measuring response to each ad spot that airs. On-Air/Off-Air: These metrics compare the average daily website traffic for days when an advertiser airs spots compared with days when they do not. Conversions: Key performance indicators along the path to respond and path to sales that advance a consumer from

  • ne stage to the next. These could be sales, form fills,

phone calls, appointments set, subscriptions, etc. *National Averages: These are determined via anonymized and aggregated data, by industry, across all advertisers connected to the AnalyticOwl platform. Across all advertiser and industries, the national average is 2-4%.

Left: 6.05% Radio Attributed Visits is higher than the national average (2-4%)*. This shows the immediate campaign impact. Right: There is significantly more traffic on on-air days (44.29% higher compared with off-air days. This proves overall performance. Advertisers know what web traffic means to their revenue based on average conversion and sales rates, re-framing the conversation to focus on results and revenue.

slide-24
SLIDE 24

Radio Drives Valuable Traffic

Increases across the board for pages/session, session duration, bounce rate, and mobile traffic show that Radio drives traffic quality in addition to traffic quantity. Radio responders stay longer, leave less, and do more, providing a boost to both conversions and SEO. Not only does Radio work, it delivers more engaged visitors.

Key Terms SEO: Search Engine Optimization refers to items that improve organic search rankings on top search engines. Pages/Session and Session Duration: How long does someone stay on a website, and how many pages do they view? Bounce Rate: What percentage of web traffic leaves a site without viewing additional pages. A bounce indicates an un-engaged site visitor.

slide-25
SLIDE 25

Campaigns Optimize

slide-26
SLIDE 26

Creative A/B Testing

The top and bottom ads are the same – only the Call-to-Action was changed – and it nearly doubled results! In general, the discussion becomes what made one ad more effective than another. It isn’t about what didn’t work, it is about what works best. What made that spot different? How can we A/B test ad copy moving forward to test that difference and put the insights to use? These discussions and the subsequent testing extends engagements, leading to longer campaigns, lower attrition, and more revenue.

Key Terms A/B Testing: Try multiple approaches (A and B) and see which one(s) drive the most audience response. Do more

  • f what works best.

Call to Action: What is the ad asking the audience to do? VPA – Visits per Airing: Across all airings, what is the average response per aired ad spot. This divides the total response (Visits) by the # of Airings, for an apples-to- apples comparison that takes frequency into consideration. Frequency: How many times did an ad spot air?

slide-27
SLIDE 27

Daypart Opportunities

Day of Week Optimization

Great opportunity to increase frequency in Midday (red) and Evening (green) to take advantage of the strong response and good value. Thursday/Friday placement confirmed, but the real opportunity is to add more

  • n Tuesdays, where response is good, but frequency is low – Turn a primarily 3-

day/week advertiser into a 4-day/week advertiser Key Terms VPA – Visits per Airing: Across all airings, what is the average response per aired ad spot. Frequency: How many times did an ad spot air?

slide-28
SLIDE 28

Beyond Web Foot Traffic

This advertiser isn’t open on Sundays, so they do not air ad spots. Green: Note that Monday is their lowest day of the week for foot traffic. Red: What if you could show them that Sunday Evening ads drove Monday morning Foot Traffic? Add that test to the campaign and turn a 6 day/week advertiser into a 7 day/week advertiser.

Why Foot Traffic? For advertisers that focus more on physical visits than web visits, Foot Traffic shows correlations between their campaigns and increases in people visiting their location(s). The ability to provide multiple forms of data makes it easier to pre-plan a campaign by understanding how success will be measured, and what metrics will be used as performance indicators.

slide-29
SLIDE 29

Change the Industry

The ability to make Radio as trackable and accountable as digital changes the perception of the medium, and makes everyone’s job easier. Again, data from across all of our partners shows that, over time:

  • Connected advertisers cancel 50% less often
  • 65% of Advertisers who review data spend more money year-
  • ver-year
  • They tend to spend 15% - 25% more

Reverse the flow of dollars from broadcast to digital, protect your revenue, and increase share and spend by confidently taking credit for the fantastic response that Radio generates.

RADIO DRIVES RESPONSE AND DATA DRIVES REVENUE

Proven Results 3+ Billion Responses to Over 17 Million Ad Spots from 10,000+ Advertisers 270+ Million Mobile Devices

slide-30
SLIDE 30

Qu Ques estio ions?

slide-31
SLIDE 31

31

THANK YOU!

C o n t a c t : d m s @ a n a l y t i c o w l . c o m a n a l y t i c o w l . c o m 1 - 8 4 4 - F I S C O W L / 1 - 9 1 7 - 8 0 8 - 4 2 9 7

B r o a d c a s t A t t r i b u t i o n • D i g i t a l A t t r i b u t i o n F o o t T r a f f i c A t t r i b u t i o n • S a l e s A t t r i b u t i o n

AnalyticOwl