
SLIDE 1
Capacitance Studies on Anode Measurements and Simulations Caspar - - PowerPoint PPT Presentation
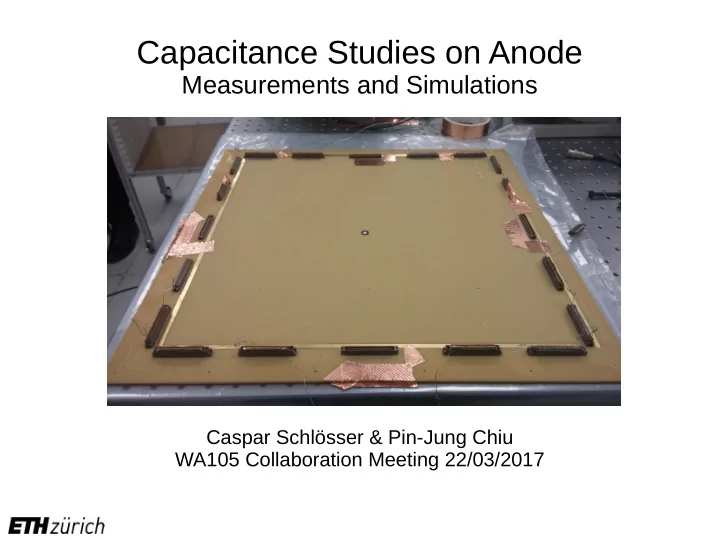
Capacitance Studies on Anode Measurements and Simulations Caspar Schlsser & Pin-Jung Chiu WA105 Collaboration Meeting 22/03/2017 Goal Capacitance studies of the anode: Measurements: capacitance measurements with LCR meter
WA105 Collaboration Meeting 2
WA105 Collaboration Meeting 3
WA105 Collaboration Meeting 4
One connector pulsed
WA105 Collaboration Meeting 5
rise/fall times: ~100 ns Period: ~0.3 s
Event viewer time window
WA105 Collaboration Meeting 6
view 0 view 1 32 pulsed channels in view 1
WA105 Collaboration Meeting 7
32 pulsed channels in view 1 view 0
view 1
Induced signal on other channels
WA105 Collaboration Meeting 8
767 ADC counts
channels: ~ 1.6-7.6 %
distance of non-pulsed channel to pulsed channel or view (parallel or perpendicular)
WA105 Collaboration Meeting 9
WA105 Collaboration Meeting 10
Cross-Talk Study Capacitance between any of the two strips and all the others are connected to ground (ground terminal of the LCR meter for a reference ground). Capacitance to ground All strips are connected to the anode back strip and the anode back strip is left floating. Capacitance measured between 1 strip and the ground.
LCR meter
Ground of LCR meter Anode back strip Anode (measured strips in blue; else in red)
LCR meter
Ground of LCR meter Anode back strip Anode (measured strips in blue; else in red)
WA105 Collaboration Meeting 11
Strip-to-strip parallel capacitance decreases rapidly with distance Measurement conditions: Humidity: 39.8 % Temperature: 19.4 °C Capacitance measured between parallel strips with varying distance All other strips grounded
WA105 Collaboration Meeting 12
Very similar capacitance measured between all combinations of perpendicular strips Measurement conditions: Humidity: 39.8 % Temperature: 19.4 °C middle edge Capacitance measured between perpendicular strips Comparison to capacitance between parallel strips: All other strips grounded
WA105 Collaboration Meeting 13
Capacitance measured between 1 strip and ground All other strips are connected to the anode back strip and the anode back strip is left floating Capacitance to ground ~ 78 pF
WA105 Collaboration Meeting 14
WA105 Collaboration Meeting 15
WA105 Collaboration Meeting 16
3D geometry
y1 y2 y3 y4 y5 y6 y7 y8 y9 y10 y11 y12 x1 x2 x3x4 x5 x6x7 x8 x9 x10 x11 x12
y1 y12 y1 x1 x12 x12 To replicate the measurement, 1V is applied to 1 strip and all the others are set to ground. Capacitance matrix contains all the 12 strips in x view and the 12 strips in y view. With this matrix, capacitance between parallel and perpendicular strips can be obtained.
WA105 Collaboration Meeting 17
1 strip and ground closest parallel strips perpendicular strips Result from simulation 41.83 pF 3.34 pF 0.22 pF Result from measurement 78 pF 7.6 pF 0.5 pF
WA105 Collaboration Meeting 18
WA105 Collaboration Meeting 19
WA105 Collaboration Meeting 20
➔ Capacitance between parallel strips decreases rapidly with
➔ Capacitance between perpendicular strips (0.5 pF) ~10% of
➔ Capacitance to ground ~ 78 pF.
➔ We were able to model the anode and have a preliminary