
Brule River Preservation LLC Properties Fire History
Progress Summary
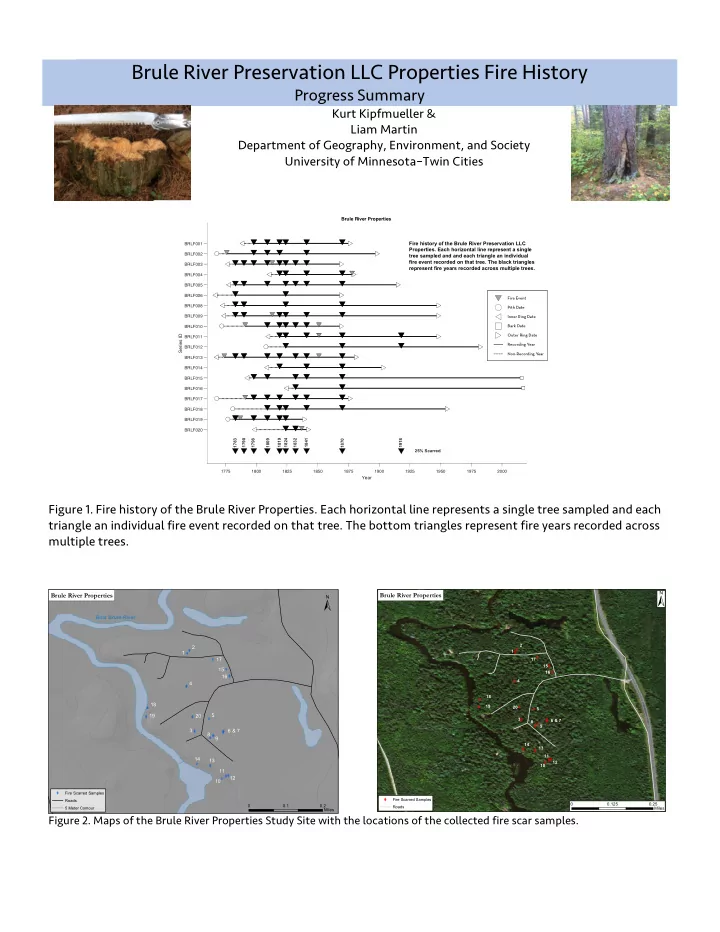
Kurt Kipfmueller & Liam Martin Department of Geography, Environment, and Society University of Minnesota–Twin Cities Figure 1. Fire history of the Brule River Properties. Each horizontal line represents a single tree sampled and each triangle an individual fire event recorded on that tree. The bottom triangles represent fire years recorded across multiple trees.
Figure 2. Maps of the Brule River Properties Study Site with the locations of the collected fire scar samples.
1775 1800 1825 1850 1875 1900 1925 1950 1975 2000 Year BRLF020 BRLF019 BRLF018 BRLF017 BRLF016 BRLF015 BRLF014 BRLF013 BRLF012 BRLF011 BRLF010 BRLF009 BRLF008 BRLF006 BRLF005 BRLF004 BRLF003 BRLF002 BRLF001 Series ID Brule River Properties 25% Scarred
- 2
2
- Fire history of the Brule River Preservation LLC
- Properties. Each horizontal line represent a single
tree sampled and and each triangle an individual fire event recorded on that tree. The black triangles represent fire years recorded across multiple trees.
Fire Event Pith Date Inner Ring Date Bark Date Outer Ring Date Recording Year Non-Recording Year
Bois Brule River X
Fire Scarred Samples Roads 5 Meter Contour
±
0.2 0.1 Miles
Brule River Properties
1 2 4 18 19 17 15 16 20 3 14 13 10 11 12 5 8 9 6 & 7
X
Fire Scarred Samples Roads
±
0.25 0.125 Miles
Brule River Properties
1 2 17 15 16 4 20 3 19 18 5 6 & 7 8 9 13 14 10 11 12