
SLIDE 1
Brownian motion (on a phylogeny)
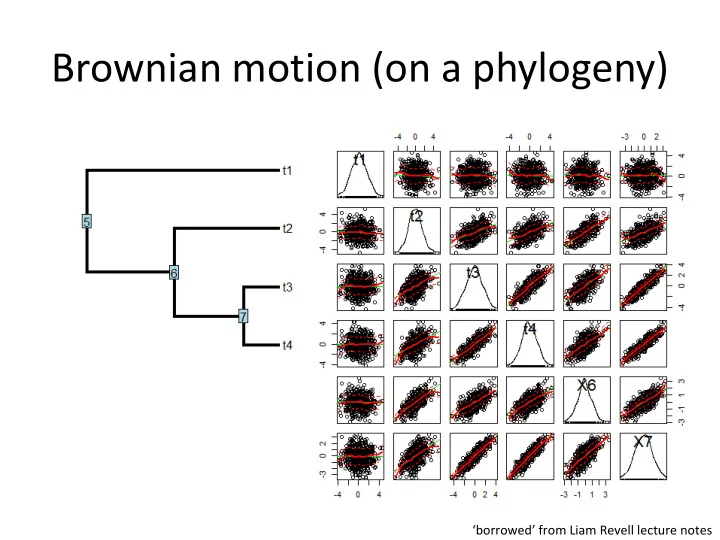
‘borrowed’ ¡from ¡Liam ¡Revell ¡lecture ¡notes ¡
Brownian motion (on a phylogeny) borrowed from Liam Revell - - PowerPoint PPT Presentation
Brownian motion (on a phylogeny) borrowed from Liam Revell lecture notes Brownian motion (on a phylogeny) The expected distribution of the tips & nodes of the tree under Brownian motion is multivariate normal
‘borrowed’ ¡from ¡Liam ¡Revell ¡lecture ¡notes ¡
‘borrowed’ ¡from ¡Liam ¡Revell ¡lecture ¡notes ¡
Blomberg et al. 2003 Evolution examples from Ackerly 2009 PNAS
Data diagnostics
K ¡> ¡1 ¡
Evolutionary models
Evolutionary models
Evolutionary models
the math: brownian motion + ‘rubber band effect’ change is unbounded (in theory), but as rubber band gets stronger, bounds are established in practice repeated movement back towards center erases phylogenetic signal, leading to K << 1
50 100 150 200 250 300
5 10 15 time trait value
see Hansen 1997 Evolution Butler and King 2004 Amer. Naturalist
time var(x)
time var(x)
Diversification of height in maples, Ceanothus and silverswords
~30 Ma ~45 Ma
rate = 0.015 felsens 0.10 felsens 0.83 felsens
Ackerly 2009 PNAS
~5.2 Ma
Evolutionary rates
Rates of phenotypic diversification (estimated for Brownian motion model)
North temperate California Hawai’i
±1 s.e. Ackerly, PNAS in review