
SLIDE 1
Phylogeny
Topic 7.9
Phylogeny Topic 7.9 Phylogeny Phylogeny is the evolutionary - - PowerPoint PPT Presentation
Phylogeny Topic 7.9 Phylogeny Phylogeny is the evolutionary history of a species or a group of species Goal of Phylogenetics: the resulting phylogeny should match taxonomy (classification of an organism) Phylogeny and Classification
Topic 7.9
species or a group of species
should match taxonomy (classification of an
(homologies) of living or fossil species, DNA and protein sequences
accurate and reliable evidence than morphological traits
Molecular Evidence Chimpanzee is more closely related to humans than other apes Morphological Evidence (or pre-molecular data) Apes are more closely related to each other than they are to humans
hypotheses about the evolutionary history of and relationships between groups of
based on new evidence
years
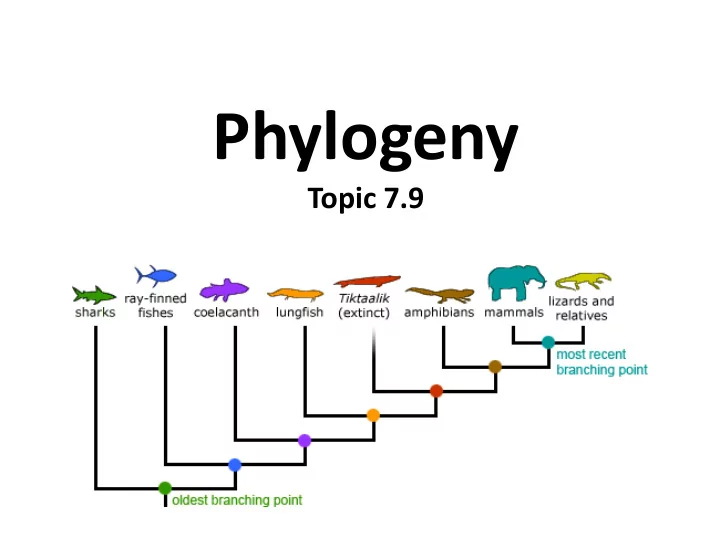
phylogenetic trees
the bottom of the page for page 2 of Understanding Phylogenies
an immediate common ancestor
recent common ancestor of a group
branches originate in the tree
lineages
genetic change over time calibrated by fossils
Phylogenetic Tree Cladogram
descendants
group
compared across organisms, such as physical characteristics (morphology), genetic sequences, and behavioral traits
evolved in one group but not in the other group (a new trait or evolutionary novelty)
evolved in a common ancestor of both groups
mammals
ventricles in bird and mammalian hearts
determine relatedness
least closely related to the remainder of the
cladogram
genetics to determine evolutionary relationships
–Need common genes between species –Gene sequences need to be “aligned” first
(This is a tutorial on sequence alignment)
the number of matching nucleotides in all compared sequences
the simplest explanation that is consistent with the facts
maximum parsimony when choosing a tree as a hypothesis
requires the fewest evolutionary events or fewest amount of molecular changes
There is a reason for this cat picture……
table below, build a tree of the most likely evolutionary history of these organisms