Phylogeny Phylogeny Evolutionary history of a species or a group of - - PowerPoint PPT Presentation

phylogeny phylogeny
SMART_READER_LITE
LIVE PREVIEW

Phylogeny Phylogeny Evolutionary history of a species or a group of - - PowerPoint PPT Presentation

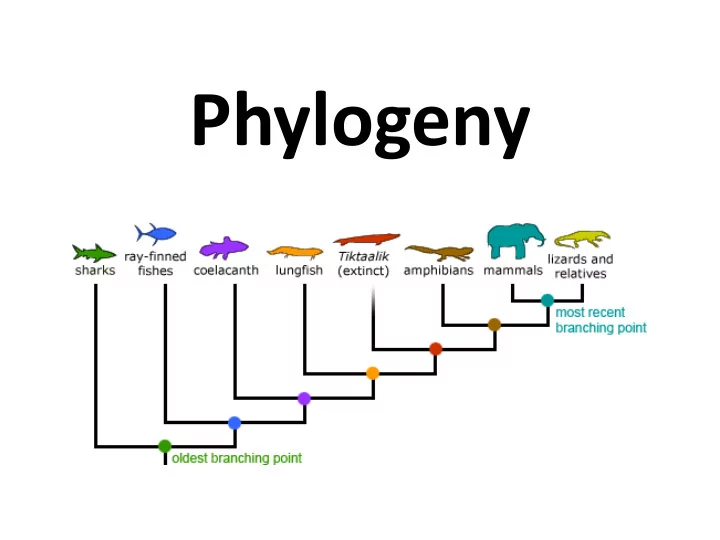
Phylogeny Phylogeny Evolutionary history of a species or a group of species Goal: Resulting phylogeny should match taxonomy (classification of an organism) Phylogeny and Classification Phylogenetic Tree Constructed using


slide-1
SLIDE 1

Phylogeny

slide-2
SLIDE 2

Phylogeny

  • Evolutionary history of a species or a group of

species

  • Goal: Resulting phylogeny should match

taxonomy (classification of an organism)

slide-3
SLIDE 3

Phylogeny and Classification

slide-4
SLIDE 4

Phylogenetic Tree

  • Constructed using morphological similarities

(homologies) of living or fossil species, DNA and protein sequences

  • Show evolutionary history and relationships

among groups of organisms (hypothesis)

  • Trees are dynamic (constantly being revised)
slide-5
SLIDE 5

Understanding Phylogenies

  • Click on the hyperlink above for an

introduction to phylogenetic trees

  • Read the first page and then click “next” at

the bottom of the page for page 2 of Understanding Phylogenies

  • Write down 3 things in your notes that you

learned about phylogeny by exploring this link

slide-6
SLIDE 6

Tree Terminology

slide-7
SLIDE 7

Tree Terminology

  • Sister taxa – groups of organisms that share

an immediate common ancestor

  • Node (branch point) – represents the most

recent common ancestor of a group

  • Root – single branch point from which all

branches originate in the tree

slide-8
SLIDE 8

Rooted versus Unrooted Trees

slide-9
SLIDE 9
slide-10
SLIDE 10

Clades

  • Clade: a group of organisms that consists of a

common ancestor and all of its descendants

slide-11
SLIDE 11

Monophyletic Group

  • A clade is also known as a monophyletic

group

slide-12
SLIDE 12

Phylogenetic Trees vs Cladograms

  • Sometimes used interchangeably
  • Branch lengths of trees may show

evolutionary time and amount of genetic change

slide-13
SLIDE 13

Character

  • Characters are heritable traits that can be

compared across organisms, such as physical characteristics (morphology), genetic sequences, and behavioral traits

  • Example: wings shown below
slide-14
SLIDE 14

Derived versus Ancestral Characters

  • A derived character is one that evolved in one

group but not in the other group (a new trait)

  • An ancestral character is thought to have

evolved in a common ancestor of both groups

slide-15
SLIDE 15

Derived versus Ancestral Characters

  • Identify a derived character for mammals
  • Identify an ancestral character for mammals
slide-16
SLIDE 16

Example of a Derived Trait

  • Number of heart chambers in animals
  • Tbx5 protein influences the formation of two

ventricles in bird and mammalian hearts

slide-17
SLIDE 17

Trees Show Speciation Events and Relatedness

  • Examine common ancestry in order to

determine relatedness

  • Who is species 5 most closely related to?
slide-18
SLIDE 18

Outgroup

  • An outgroup is a group of organisms that

serve as a reference group when determining the evolutionary relationship among a monophyletic group of organisms

  • Used as a point of comparison for the ingroup
  • Example:
  • Chordates – Ingroup
  • Echinodermata - Outgroup
slide-19
SLIDE 19

Chordate Evolution

slide-20
SLIDE 20

Another Outgroup Example

slide-21
SLIDE 21

Trees May Show Time and Extinct Lineages

slide-22
SLIDE 22

Extinct versus Extant

slide-23
SLIDE 23

Phylogenetic Trees Based on Sequence Data

  • Use of molecular (i.e. DNA, proteins) genetics

to determine evolutionary relationships

  • Disadvantages

–Need common genes –Gene sequences need to be “aligned” first

slide-24
SLIDE 24

Sequence Alignment

  • Goal of Sequence Alignment: Maximize the

number of matching nucleotides in all compared sequences

  • Compare SNPs and Indels
slide-25
SLIDE 25

SNPs and Indels

  • SNPs – single nucleotide polymorphisms
  • Indels – insertions and deletions
slide-26
SLIDE 26

Maximum Parsimony

  • Choosing a tree that

requires the fewest evolutionary events (fewest amount of molecular changes)

  • The simplest

explanation that is consistent with the facts

slide-27
SLIDE 27

Which is the most parsimonious tree?

slide-28
SLIDE 28

Constructing a Phylogenetic Tree

  • May require the use of a character table
  • + or 1 indicates the presence of the character,
  • or 0 indicates the absence of the character
slide-29
SLIDE 29

Now You Try It

  • Based on the shared characteristics in the

table below, build a tree of the most likely evolutionary history of these organisms

  • + (present), - (absent)
slide-30
SLIDE 30