SLIDE 1 Bellevue School District 405 DRAFT Facilities Strategy – 2015 - 2022 Western Demographics, Inc. 1 January 6, 2015
Bellevue School District No. 405 DRAFT Facilities Strategy – 2015 – 2022 January 6th 2015 Executive Summary – The Bellevue School District No. 405 grew significantly during the last three school years and this growth is expected to continue during the next five to eight years. All indicators continue to point to continued growth with birth rates, new multi-family housing construction and in-migration of new families producing new students at consistent, sustainable
- rates. The district’s bond-funded capital construction program will adequately address needed
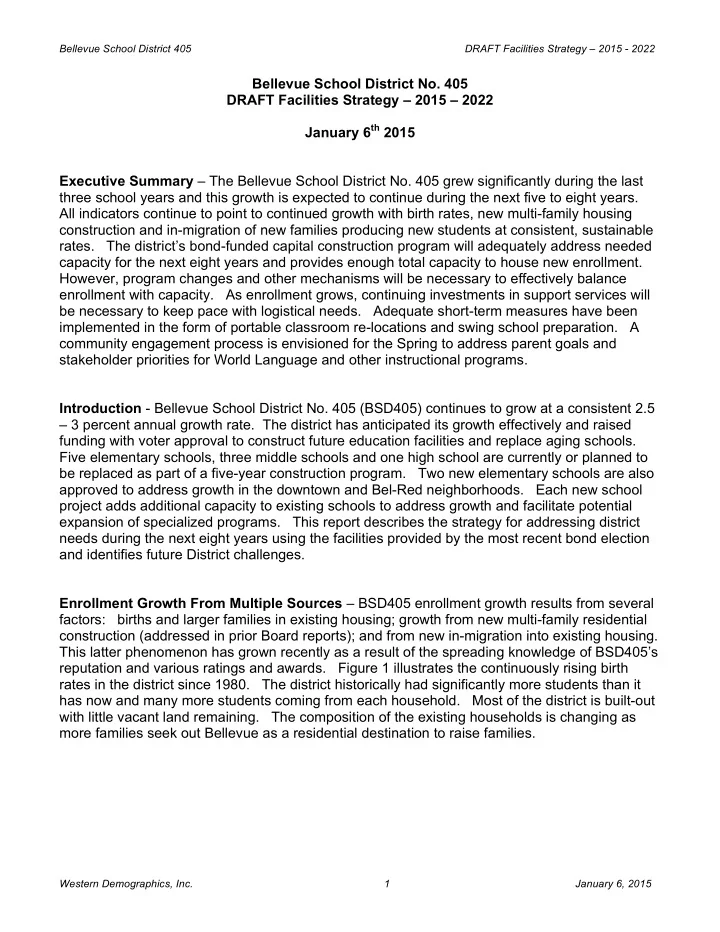
capacity for the next eight years and provides enough total capacity to house new enrollment. However, program changes and other mechanisms will be necessary to effectively balance enrollment with capacity. As enrollment grows, continuing investments in support services will be necessary to keep pace with logistical needs. Adequate short-term measures have been implemented in the form of portable classroom re-locations and swing school preparation. A community engagement process is envisioned for the Spring to address parent goals and stakeholder priorities for World Language and other instructional programs. Introduction - Bellevue School District No. 405 (BSD405) continues to grow at a consistent 2.5 – 3 percent annual growth rate. The district has anticipated its growth effectively and raised funding with voter approval to construct future education facilities and replace aging schools. Five elementary schools, three middle schools and one high school are currently or planned to be replaced as part of a five-year construction program. Two new elementary schools are also approved to address growth in the downtown and Bel-Red neighborhoods. Each new school project adds additional capacity to existing schools to address growth and facilitate potential expansion of specialized programs. This report describes the strategy for addressing district needs during the next eight years using the facilities provided by the most recent bond election and identifies future District challenges. Enrollment Growth From Multiple Sources – BSD405 enrollment growth results from several factors: births and larger families in existing housing; growth from new multi-family residential construction (addressed in prior Board reports); and from new in-migration into existing housing. This latter phenomenon has grown recently as a result of the spreading knowledge of BSD405’s reputation and various ratings and awards. Figure 1 illustrates the continuously rising birth rates in the district since 1980. The district historically had significantly more students than it has now and many more students coming from each household. Most of the district is built-out with little vacant land remaining. The composition of the existing households is changing as more families seek out Bellevue as a residential destination to raise families.
SLIDE 2 Bellevue School District 405 DRAFT Facilities Strategy – 2015 - 2022 Western Demographics, Inc. 2 January 6, 2015
Figure 1 Historical Enrollment – Historical enrollment has consistently grown during the past eight school years with approximately 2,650 new students enrolled in the district during that period. All growth vectors reinforcing the continuation of this trend have stabilized during the past two years insuring the continuation of a solid growth picture for the district. Figure 2 illustrates the
- verall enrollment trend. All three school levels, have shown growth during this period.
Figure 2 Growth Forecast – Future expectations of BSD405 enrollment reveal a continuation of the growth rates experienced during the past two to three years with strong growth for the next five years and slightly more moderate growth for the subsequent five years. Almost 4,000 new students will be added, as shown in Figure 3, during this period if current trends from the three factors continue. Growth is consistent among the three school levels as shown in Figure 4.
835$ 913$ 903$ 833$ 842$ 889$ 924$ 904$ 979$ 1,094$ 1,053$ 1,061$ 1,117$ 1,237$ 1,283$ 1,183$ 1,302$ 1,319$ 1,246$ 1,271$ 1,388$ 1,357$ 1,329$ 1,378$ 1,395$ 1,287$ 1,438$ 1,408$ 1,443$ 1,480$ 1,437$ 1,588$ 1,660$ 1,565$
800# 900# 1,000# 1,100# 1,200# 1,300# 1,400# 1,500# 1,600# 1,700# 1980# 1981# 1982# 1983# 1984# 1985# 1986# 1987# 1988# 1989# 1990# 1991# 1992# 1993# 1994# 1995# 1996# 1997# 1998# 1999# 2000# 2001# 2002# 2003# 2004# 2005# 2006# 2007# 2008# 2009# 2010# 2011# 2012# 2013#
Bellevue$Births$
16520& 16937& 17310& 17840& 18120& 18419& 18588& 19176& 15000& 16000& 17000& 18000& 19000& 20000& 2007& 2008& 2009& 2010& 2011& 2012& 2013& 2014&
BSD405'Historical'Enrollment'5'2007'5'2014'
Historical&Enrollment&
SLIDE 3
Bellevue School District 405 DRAFT Facilities Strategy – 2015 - 2022 Western Demographics, Inc. 3 January 6, 2015
Figure 3 Figure 4 BSD405 – Enrollment Forecast by Level – 2015 - 2024 Annualized New Student Volumes – Annualized new students volumes beginning at 448 new students in 2015 will gradually diminish to 313 new students added in the 2021-22 school year according to the forecast details displayed in Figure 5. The district anticipated much of this enrollment growth in the previous bond election and added 3,947 seats in anticipation. In addition to new seats, other district support services will have to be adjusted to address additional enrollment. The district has attempted to improve administration, maintenance and transportation facility support functions as part of the current construction program, but incremental additional school bus purchases and other student support needs such as warehousing are currently unfunded. Even though the growth expected is 4,000 students and the seats provided are close to that number, adjustments in existing space and how students and programs are assigned to individual buildings will need to be addressed as growth continues. Most of the new space will be provided by the end of the six-year construction program shown in green allowing the assignment of the space in advance of the remaining enrollment growth.
19,176& 19,675& 20,122& 20,576& 20,984& 21,389& 21,692& 22,028& 22,341& 22,712& 23,052& 0& 5,000& 10,000& 15,000& 20,000& 25,000& 2014& 2015& 2016& 2017& 2018& 2019& 2020& 2021& 2022& 2023& 2024&
BSD405'('Enrollment'Forecast'('2015'('2024'
Total&Enrollment& 8,502& 8,684& 8,896& 9,049& 9,111& 9,314& 9,416& 9,542& 9,702& 9,879& 10,084& 4,385& 4,553& 4,605& 4,719& 4,881& 4,932& 5,017& 5,025& 5,175& 5,213& 5,249& 5,910& 6,060& 6,243& 6,430& 6,614& 6,765& 6,880& 7,082& 7,085& 7,241& 7,341& 0& 2,000& 4,000& 6,000& 8,000& 10,000& 12,000& 2014& 2015& 2016& 2017& 2018& 2019& 2020& 2021& 2022& 2023& 2024& (K/5)& (6/8)& (9/12)&
SLIDE 4
Bellevue School District 405 DRAFT Facilities Strategy – 2015 - 2022 Western Demographics, Inc. 4 January 6, 2015
Figure 5 Student Growth Forecast - 2014 – 2022 Students New to the District This School Year (Excluding Kindergarten) – Much of the growth in the district, given its mature housing stock, has come from new families moving into existing housing to benefit from a BSD405 education and diploma. Excluding kindergarten, more than ten percent of Bellevue students were new to the district this school year. Figure 6 shows the leading new student enrollment schools in yellow and the subsequent figures show the leading new student schools by level. Anecdotal conversations with the principals of all BSD schools reveal that many families throughout the Puget Sound region are coming to BSD405 to benefit from programs here with the starting grades of first, sixth and ninth having strong new student counts all over the district. Top four or five schools for new student enrollment at each level are shown in Figures 7, 8 and 9.
Enrollment Forecast (K-5) (6-8) (9-12) (K-12) Sped Preschool TK12SP 2014 8,502 4,385 5,910 18,797 379 700 19,176 2015 8,684 4,553 6,060 19,296 379 720 19,675 2016 8,896 4,605 6,243 19,743 379 740 20,122 2017 9,049 4,719 6,430 20,197 379 760 20,576 2018 9,111 4,881 6,614 20,605 379 780 20,984 2019 9,314 4,932 6,765 21,010 379 800 21,389 2020 9,416 5,017 6,880 21,313 379 820 21,692 2021 9,542 5,025 7,082 21,649 379 840 22,028 2022 9,702 5,175 7,085 21,962 379 860 22,341 Net Growth (K-5) (6-8) (9-12) (K-12) Sped ps TK12SP 2014-15 182 168 150 499 20 499 2015-16 212 52 184 448 20 448 2016-17 154 114 187 454 20 454 2017-18 62 162 185 408 20 408 2018-19 203 51 151 405 20 405 2019-20 102 86 115 303 20 303 2020-21 126 8 202 336 20 336 2021-22 160 149 3 313 20 313 Total Growth Through 2022-23 School Year 1,200 790 1,175 3,165 160 3,165 Capacity Added 2015 - 2022 2,323 1,176 448 3,947
SLIDE 5
Bellevue School District 405 DRAFT Facilities Strategy – 2015 - 2022 Western Demographics, Inc. 5 January 6, 2015
Figure 6 Figure 7 - Top 5 Schools for New Elementary Students Figure 8 - Top 5 Schools for New Middle School Students
Name 1 2 3 4 5 6 7 8 9 10 11 12 Grand Total ARDMORE 14 9 9 7 7 46 BELLEVUE BIG PICTURE SCH 6 4 8 3 2 1 24 BELLEVUE HIGH SCHOOL 61 44 44 24 173 BENNETT 12 15 4 6 5 42 BSD CAREER & TECH ED 6 18 24 CENTRAL EDUCATION SERVICES 1 1 CHERRY CREST 14 26 11 5 6 62 CHINOOK MIDDLE SCHOOL 47 54 40 141 CLYDE HILL 30 21 26 22 20 119 EASTGATE 11 10 7 10 5 43 ENATAI 21 12 16 11 22 82 HIGHLAND MIDDLE SCHOOL 27 22 18 67 INTERLAKE HIGH SCHOOL 81 28 26 12 147 INTERNATIONAL SCHOOL 14 1 2 17 JING MEI ELEMENTARY SCH 6 1 2 9 LAKE HILLS 17 8 3 7 6 41 MEDINA 6 16 8 11 10 51 NEWPORT HEIGHTS 23 13 7 13 16 72 NEWPORT HIGH SCHOOL 62 26 31 14 133 ODLE MIDDLE SCHOOL 33 16 21 70 PHANTOM LAKE 11 2 8 1 3 25 PUESTA DEL SOL 2 1 2 5 SAMMAMISH HIGH SCHOOL 38 25 30 22 115 SHERWOOD FOREST 8 1 7 2 4 22 SOMERSET 28 11 21 13 15 88 SPIRITRIDGE 17 17 12 11 5 62 STEVENSON 24 10 10 13 9 66 TILLICUM MIDDLE SCHOOL 20 6 10 36 TRANSFERS OUT 1 2 1 1 3 1 2 1 6 18 TRANSITION PROGRAM 1 1 TYEE MIDDLE SCHOOL 62 31 38 131 WOODRIDGE 27 16 23 24 16 106 Grand Total 272 192 178 159 151 213 135 137 246 127 138 98 2046
Students New to the District - (Fresh Student Numbers January - October 2014) Name 1 2 3 4 5 Total CLYDE HILL 30 21 26 22 20 119 WOODRIDGE 27 16 23 24 16 106 SOMERSET 28 11 21 13 15 88 NEWPORT HEIGHTS 23 13 7 13 16 72 STEVENSON 24 10 10 13 9 66 Name 6 7 8 Total CHINOOK MIDDLE SCHOOL 47 54 40 141 TYEE MIDDLE SCHOOL 62 31 38 131 ODLE MIDDLE SCHOOL 33 16 21 70 HIGHLAND MIDDLE SCHOOL 27 22 18 67 TILLICUM MIDDLE SCHOOL 20 6 10 36
SLIDE 6 Bellevue School District 405 DRAFT Facilities Strategy – 2015 - 2022 Western Demographics, Inc. 6 January 6, 2015
Figure 9 - Top 5 Schools for New High School Students New Students by Housing Type (Excluding Kindergarten) – A relatively large number of new students enrolled in the district have multi-family home addresses demonstrating the increasing popularity of apartments, townhomes and condominiums as family dwellings. The 37 / 63 percent multi- / single family mix for new resident addresses is higher than the 21 / 79 percent mix for all current residents. Figure 10 - Multi- / Single Family Mix for New Resident Addresses Elementary School Space Added – Figure 11 illustrates the 101 new elementary school rooms and 2,323 seats that will be added as a result of the current construction program. All capacity figures elsewhere in this report reflect the new and reconstructed facilities and their new capacities. Portable classrooms and temporary “swing schools” will continue to be necessary during the next five years as the new facilities are constructed to address current student housing needs. Figure 11 – New Elementary School Space – 2014 – 2021 Construction Program
Name 9 10 11 12 Total BELLEVUE HIGH SCHOOL 61 44 44 24 173 INTERLAKE HIGH SCHOOL 81 28 26 12 147 NEWPORT HIGH SCHOOL 62 26 31 14 133 SAMMAMISH HIGH SCHOOL 38 25 30 22 115
Single ¡ Family ¡ Housing ¡ 63% ¡ Multi-‑ family ¡ Housing ¡ 37% ¡
Seats Added Existing Capacity New Capacity Inrease in Capacity Enatai 28 34 6 Bennett 22 34 12 ES#18 @ Galeno 34 34 Stevenson 31 34 3 Clyde Hill 30 37 7 Puesta del Sol 29 34 5 ES#19 34 34 Total 140 241 101 Seats Added Existing Capacity New Capacity Inrease in Capacity Enatai 644 782 138 Bennett 506 782 276 ES#18 @ Galeno 782 782 Stevenson 713 782 69 Clyde Hill 690 851 161 Puesta del Sol 667 782 115 ES#19 782 782 Total 3220 5543 2323 Elementary - Rooms Elementary - Seats
SLIDE 7 Bellevue School District 405 DRAFT Facilities Strategy – 2015 - 2022 Western Demographics, Inc. 7 January 6, 2015
Middle School Space Added – Approximately 42 new middle school rooms will be gained as a result of the three middle school facilities that will be reconstructed during the construction
- program. BSD405 middle schools run on seven period days and classrooms are used for
planning and academic lesson staging for portions of the academic day. Secondary School Capacity - Capacities in this report are discussed based on how many periods during the academic day the classrooms are utilized for instruction - as a five of seven periods, six of seven periods, or seven of seven periods. Changing the intensity of classroom usage during the academic day can either increase or decrease the instructional capacity of the
- building. However, addressing the instructional capacity in this manner can result in continued
issues in common space capacity such as hallways, cafeterias, restrooms, etc. The most logistically feasible capacity use rate is the 5 of 7 periods in use model and the most logistically challenging is the 7 of 7 model. BSD405 middle and high schools currently use a range of this intensity use model and will continue to do so. The space in Figure 12 is shown at “Face Value” or using the maximum 7 of 7 periods in use model. Figure 12 - Middle School Space Added High School Space Added – Figure 13 illustrates the space added at the reconstructed Sammamish High School and in the planned ten-classroom addition at Newport High School. Again, these spaces are shown using the maximum capacity gained 7 of 7 capacity model. Figure 13 - High School Space Added
Existing Capacity New Capacity Inrease in Capacity Odle 44 51 7 Tillicum 35 55 20 Highland 36 51 15 Total 115 157 42 Existing Capacity New Capacity Inrease in Capacity Odle 1232 1428 196 Tillicum 980 1540 560 Highland 1008 1428 420 Total 3220 4396 1176 Middle - Rooms Middle - Seats @ Face Value Existing Capacity New Capacity Inrease in Capacity Newport HS Addition 10 10 Sammamish 71 77 6 Total 71 87 16 Existing Capacity New Capacity Inrease in Capacity Newport HS Addition 280 280 Sammamish 1988 2156 168 Total 1988 2436 448
High - Rooms High - Seats @ Face Value
SLIDE 8 Bellevue School District 405 DRAFT Facilities Strategy – 2015 - 2022 Western Demographics, Inc. 8 January 6, 2015
New Elementary Room Usage Mix - (Not Counting Elementary #19) – The new elementary school rooms added will address a variety of new space needs associated with growth and academic program needs and allow for the continuing growth in Low Incidence Special Education programs (LISPED) such as Olympic, Cascade and Pacific along with the District’s Special Education Preschool Program (PALS). The continuing growth of early childhood programs will be partially addressed as those programs grow as a percentage of enrollment. Figure 14 Percentage of New Space for Potential Special Programs vs. Growth Rooms Available for Special Programs – As new spaces come on line, blocks of three to five rooms will become available for low incidence special education programs and other critical district activities. Locations for program divisions are under examination to facilitate the best distribution of district staff and resources driven by where children live. The reconstructed spaces will allow for a broad distribution of un-programmed space throughout the district and allow a more effectively distributed deployment model for district resources. Figure 15 Un-programmed Elementary School Classrooms Resulting from New Construction Growth ¡ 71% ¡ Special ¡ Programs ¡ 29% ¡
School Name Fall_2014 2015 2016 2017 2018 2019 2020 2021 ARDMORE 2 2 2 2 2 2 2 2 BENNETT 6 6 6 6 6 CHERRY CREST CLYDE HILL
4 4 4 EASTGATE 1 1 1 1 1 1 1 1 ENATAI
4 4 4 4 4 4 LAKE HILLS MEDINA NEWPORT HEIGHTS PHANTOM LAKE 1 1 1 1 1 1 1 1 PUESTA DEL SOL 1 1 SHERWOOD FOREST 1 2 2 2 2 2 2 2 SOMERSET
SPIRITRIDGE 1 1 STEVENSON 3 3 3 3 5 5 5 5 WOODRIDGE
ES#18 - GALENO 5 5 5 5 5 APPROXIMATE TOTALS 5 3 11 22 24 29 30 30 ES#19 - Future Growth
BSD405 Un-Programed Elementary School Classrooms - 12/29/14 - DRAFT
SLIDE 9 Bellevue School District 405 DRAFT Facilities Strategy – 2015 - 2022 Western Demographics, Inc. 9 January 6, 2015
Potential Special Program Redeployment Opportunities – New spaces could allow five more sites for Low Incidence Special Education programs (LISPED) as shown in Figure 16 and seven locations where the district’s Early Learning Program (ELP) could also be expanded over the next five-to-eight years. The PALS special education preschool program could benefit from spreading from its current single location at Phantom Lake into three to four locations as indicated by the proposed expansion locations indicated in the third column from the left in Figure 16. The LISPED and ELP potential expansion sites are indicated in the two right
- columns. In the event that State legislation funds reduced primary grade class sizes, these
spaces could also be used to facilitate reduced class sizes if 17:1 district-wide staffing ratios become financially viable for grades kindergarten through second grade. Figure 16 New School Opening Schedule – The current construction plans and schedule for the facilities in the six-year program are listed in Figure 17. These are all contingent on many uncontrollable factors including the availability of materials, labor and contractors. Figure 17
School Name Fall_2014 2015 2016 2017 2018 2019 2020 2021 CURRENT CENTER POTENTIAL PALS REDEPLOYMENT POTENTIAL LOW INCIDENCE REDEPLOYMENT ELP ARDMORE 2 2 2 2 2 2 2 2 CASCADE PALS, Typical Peers ELP BENNETT 6 6 6 6 6 PALS, Typical Peers ELP LISPED ELP CHERRY CREST CLYDE HILL
4 4 4 LISPED ELP EASTGATE 1 1 1 1 1 1 1 1 OLYMPIC ENATAI
4 4 4 4 4 4 PALS, Typical Peers ELP LAKE HILLS MEDINA NEWPORT HEIGHTS PACIFIC PHANTOM LAKE 1 1 1 1 1 1 1 1 PALS PALS, Typical Peers ELP LISPED ELP (Title 1) PUESTA DEL SOL 1 1 SHERWOOD FOREST 1 2 2 2 2 2 2 2 PACIFIC ELP (Title 1) SOMERSET
SPIRITRIDGE 1 1 ELP STEVENSON 3 3 3 3 5 5 5 5 ELP (Title 1) WOODRIDGE
CASCADE ES#18 - GALENO 5 5 5 5 5 PALS, Typical Peers ELP LISPED ELP APPROXIMATE TOTALS 5 3 11 22 24 29 30 30 ES#19 - Future Growth LISPED ELP
Redeployment Opportunities
School Year Elementary Middle High 2016 - 17 Enatai Odle
10-Classroom Addition to Newport HS
2018 - 19 Stevenson Tillicum 2019 - 20 Clyde Hill 2020 - 21 Puesta del Sol, ES#19 Highland New and Reconstructed Schools - Opening Schedule - 2016 - 2021 2017 - 18 Bennett, ES#18 @ Galeno Sammamish
SLIDE 10
Bellevue School District 405 DRAFT Facilities Strategy – 2015 - 2022 Western Demographics, Inc. 10 January 6, 2015
Swing School Schedule – Current schools that are being re-constructed will be temporarily staged at the district’s Bellewood and Ringdall facilities. The proposed assignment schedules are listed in Figure 18. Figure 18 Growth Schools – The district’s construction plan will address schools that are currently over capacity due to growth. The schools that are significantly over capacity are in the following table: Elementary Middle Schools High Schools Woodridge Chinook Bellevue Enatai Tyee Interlake Clyde Hill Newport The following graphs illustrate the extent to which growth will be remedied by new construction at a few of the schools that are affected by growth. The enrollments are shown in blue and the new school capacities are shown in blue. The new ES#18 School to be constructed on the Galeno site will result in a boundary that will absorb the downtown neighborhoods thus reducing the enrollments at Clyde Hill and Enatai. Figure 19 - New Clyde Hill Enrollment vs. Capacity School Year Elementary @ Bellewood Middle @ Ringdahl High 2014 - 15 Jing Mei Odle N/A 2015 - 16 Enatai Odle N/A 2016 - 17 Bennett Tillicum N/A 2017 - 18 Stevenson Tillicum N/A 2018 - 19 Clyde Hill Highland N/A 2019 - 20 Puesta del Sol Highland N/A BSD405 - Bellewood / Ringdahl Swing School Schedule
709$ 729$ 648$ 663$ 687$ 669$ 676$ 685$ 851$ 851$ 851$ 851$ 851$ 851$ 851$ 851$ 0$ 100$ 200$ 300$ 400$ 500$ 600$ 700$ 800$ 900$ 2015$ 2016$ 2017$ 2018$ 2019$ 2020$ 2021$ 2022$ Clyde$Hill$Elem$Sch$ Capacity$
SLIDE 11
Bellevue School District 405 DRAFT Facilities Strategy – 2015 - 2022 Western Demographics, Inc. 11 January 6, 2015
Figure 20 - New Woodridge Enrollment vs. Capacity Secondary School Growth – The district’s secondary schools will require programmatic adjustment as new space is provided. Several of these schools will trend toward the seven of seven period utilized maximum capacity over time and the district will need to balance enrollment into buildings with space using programs or other means. Secondary space is particularly tight at Chinook, Tyee, Bellevue High and Newport High. Program assignments and considerations at Sammamish High School will be especially necessary to fully utilize that building given its small attendance area. The new Elementary #18 and Elementary #19 will need new boundaries and / or program assignments. Figure 21 - New Chinook Middle School Enrollment vs. Capacity
711# 759# 662# 677# 709# 685# 685# 687# 736# 736# 736# 736# 736# 736# 736# 736# 500# 550# 600# 650# 700# 750# 800# 2015# 2016# 2017# 2018# 2019# 2020# 2021# 2022# Woodridge#Elem#Sch# Capacity#
1043% 1068% 1150% 1222% 1220% 1235% 1242% 1339% 1000% 1000% 1000% 1000% 1000% 1000% 1000% 1000% 1200% 1200% 1200% 1200% 1200% 1200% 1200% 1200% 1400% 1400% 1400% 1400% 1400% 1400% 1400% 1400% 800% 900% 1000% 1100% 1200% 1300% 1400% 1500% 2015% 2016% 2017% 2018% 2019% 2020% 2021% 2022% Chinook%Middle%Sch% "Capacity%5/7"% "Capacity%6/7"% "Capacity%7/7"%
SLIDE 12
Bellevue School District 405 DRAFT Facilities Strategy – 2015 - 2022 Western Demographics, Inc. 12 January 6, 2015
Figure 22 - New Tyee Middle School Enrollment vs. Capacity Figure 23 - Bellevue High School Enrollment vs. Capacity Figure 24 - New Newport High School Enrollment vs. Capacity
1004$ 1065$ 1160$ 1244$ 1246$ 1233$ 1213$ 1232$ 900$ 900$ 900$ 900$ 900$ 900$ 900$ 900$ 1080$ 1080$ 1080$ 1080$ 1080$ 1080$ 1080$ 1080$ 1260$ 1260$ 1260$ 1260$ 1260$ 1260$ 1260$ 1260$ 800$ 850$ 900$ 950$ 1000$ 1050$ 1100$ 1150$ 1200$ 1250$ 1300$ 2015$ 2016$ 2017$ 2018$ 2019$ 2020$ 2021$ 2022$ Tyee$Middle$Sch$ "Capacity$5/7"$ "Capacity$6/7"$ "Capacity$7/7"$ 1577$ 1623$ 1652$ 1738$ 1741$ 1802$ 1873$ 1831$ 1400$ 1400$ 1400$ 1400$ 1400$ 1400$ 1400$ 1400$ 1680$ 1680$ 1680$ 1680$ 1680$ 1680$ 1680$ 1680$ 1960$ 1960$ 1960$ 1960$ 1960$ 1960$ 1960$ 1960$ 1200$ 1300$ 1400$ 1500$ 1600$ 1700$ 1800$ 1900$ 2000$ 2015$ 2016$ 2017$ 2018$ 2019$ 2020$ 2021$ 2022$ Bellevue$High$Sch$ "Capacity$5/7"$ "Capacity$6/7"$ "Capacity$7/7"$
1739% 1810% 1943% 2005% 2138% 2199% 2257% 2275% 1780% 1780% 1780% 1780% 1780% 1780% 1780% 1780% 2136% 2136% 2136% 2136% 2136% 2136% 2136% 2136% 2492% 2492% 2492% 2492% 2492% 2492% 2492% 2492% 1500% 1700% 1900% 2100% 2300% 2500% 2700% 2015% 2016% 2017% 2018% 2019% 2020% 2021% 2022% Newport%High%Sch% "Capacity%5/7"% "Capacity%6/7"% "Capacity%7/7"%
SLIDE 13 Bellevue School District 405 DRAFT Facilities Strategy – 2015 - 2022 Western Demographics, Inc. 13 January 6, 2015
Low Incidence Special Education Programs - Actions for the Next Three Years - Special Education Preschool Programs (PALS) currently located in 13 rooms at Phantom Lake could benefit from subdivision into three or four sites. Proposed locations were mentioned previously in this report. The Cascade program is currently deployed for elementary, middle and high school according to the following scheme and may benefit during the next five years from one of the program redeployment schemes mentioned previously in this report. A third elementary location during the next five years, possibly on the west side I- 405, could be beneficial. The current deployment is as follows:
Elementary Middle Schools High Schools Ardmore Tillicum Bellevue Woodridge Odle Sammamish
The district’s Pacific program could also benefit from a third elementary location during the next five years possibly on the west side I-405. The current deployment is as follows:
Elementary Middle Schools High Schools Newport Heights Highland Interlake Sherwood Forest
The district’s Olympic program could also benefit from a second elementary location during the next five years possibly on the west side I- 405. The current deployment is as follows:
Elementary Middle Schools High Schools Eastgate Tyee Newport
World Language Programs – The district is planning to work with parents and other stakeholders through the spring to understand the needs and desires of world language program participants. With new spaces becoming available, the potential for program continuity elementary to middle to high school is attractive and feasible. The administration will work with stakeholders to determine a beneficial facility strategy. Current deployment is as follows:
Elementary Middle Schools High Schools Puesta del Sol Tillicum (Mandarin) Newport (Spanish) Jing Mei
Gifted Program – The subdivision of the gifted program into four elementary locations has been
- successful. The continuing desire of some of the stakeholders of the gifted program continues
to be a stand-alone Gifted Elementary School. The district has not suggested a mission or location for the funded Elementary #19, but neighborhood growth needs in the Bel-Red District may absorb the seats provided by this school as 2021 approaches. The administration will continue to explore the continuing needs of this program. Current deployment is as follows:
Elementary Middle Schools High Schools Cherry Crest Odle Interlake Medina Tyee Somerset Spiritridge
SLIDE 14 Bellevue School District 405 DRAFT Facilities Strategy – 2015 - 2022 Western Demographics, Inc. 14 January 6, 2015
Additional Portable Classroom Needs – Fall 2015 – The administration has processed the needs for portables for next fall and recommends the following:
- Somerset – 1 Additional Portable
- Bellewood – 3 or 5 Additional Portables depending upon plumbing issues
- Woodridge –
– 1 Additional Portable (February) – #5 – 2 Additional Portables (August) – #6 and #7
- Newport High School – 4 Portables
- Tyee Middle School – 4 Portables
Program Relocation Needs – Fall 2015 – The following program relocation actions are under consideration for the fall of 2015:
- Relocate Enatai to Bellewood Including Preservation of 2 or 3 Rooms of Early Learning
Program (ELP) Students Serving Enatai Attendance Area
- Relocate Jing Mei to Old Newport Heights
- Consider partially decentralizing PALS at Phantom Lake to a second site, consider the addition
- f ELP Typical Peers at Phantom Lake to fill vacant rooms
- Attempt to provide ELP programs to replace those lost at Bellewood as a result of the Enatai
re-location in the central core of the district focusing on Title 1 Schools. Conclusion – The next five years in the BSD405 will be characterized by change and adjustment to address new facility construction, program relocation / activation and growth. The district’s construction program has responded well to the increased enrollment resulting from new housing and demand-based growth. New and reconstructed facilities will effectively address seat demands at the elementary level and challenge some facilities at the secondary level requiring more intensive facility use. New facilities will require identities and programs that address student desires and family goals. Space at the reconstructed Sammamish, Odle and Highland schools will require additional programs or expanded missions to capture the imagination of students and fill the buildings to capacity. The district’s challenge to engage stakeholders and develop strategies to address temporary needs, transition through the swing schools and fully utilize the new facilities will be significant. Next Steps – The administration will work with principals and program directors to address portable classroom needs for the Fall of 2015 and the utilization of the swing schools. Program directors will be asked to explore scenarios proposed by the demographer to relocate special education and early learning programs and finalize recommendations for Fall of 2015. Stakeholder engagement processes will begin in the Spring to address World Language, Sammamish program and other potential academic focus areas such as excess demand at the International School.