SLIDE 15 Rithron
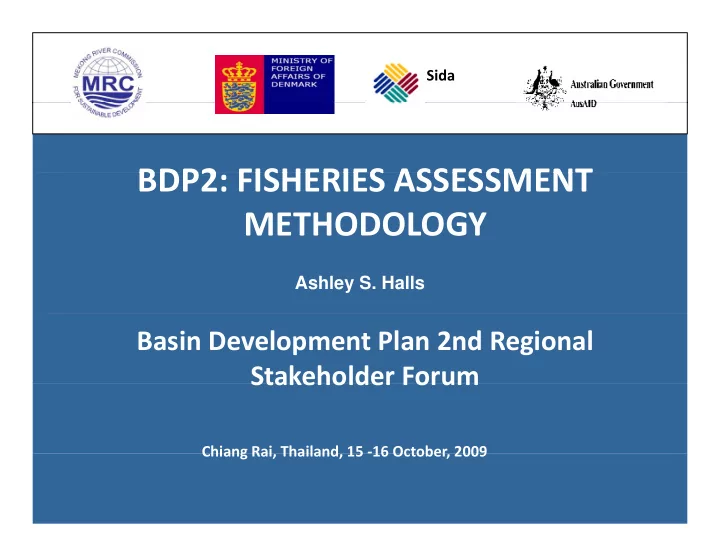
Guilds 4 & 5 Guilds 4 & 5 GUILDS 1, 6, 7 GUILDS 1, 6, 7
GUILD 1 GUILD 1
Spawning areas Spawning areas GUILDS 2, 3, 8, 9 GUILDS 2, 3, 8, 9
Tributary GUILD 6 GUILD 6 Tributary GUILD 6 GUILD 6 Irrigated and rain-fed Floodplain
Migrate long distances upstream Migrate long distances upstream to spawn (or feed) to spawn (or feed) Short distance migrations in Short distance migrations in main channel main channel
Guild Name Examples 1 Rithron resident Raiamas guttatus Tor laterivittatus T i i Guild Name Examples 2 Channel Resident Hypsibarbus malcolmi Probarbus jullieni P i h hil
Guild 4: Guild 4: Obli l l Obli l l Guild 5: Guild 5: N bli t bli t
Species resident in the rithron, Species resident in the rithron, estuary and floodplains. estuary and floodplains.
wetlands e.g. rice fields Outside flood zone GUILD 6 GUILD 6
to spawn (or feed). to spawn (or feed). Adults and drifting eggs/ larvae/ Adults and drifting eggs/ larvae/ juveniles return to downstream juveniles return to downstream feeding habitat. feeding habitat. main channel. main channel. Lateral migrations between Lateral migrations between channel & floodplain. channel & floodplain.
Tor sinensis 6 Blackfish Channa micropeltes Clarias batrachus Anabas testudineus 7 Delta Resident Arius maculates Glossogobius giuris
Guild Name Examples
GUILD 3 GUILD 3
Pangasius conchophilus 3 Channel Spawner Cosmochilus harmandi; Henicorhynchus siamensis; Paralaubuca typus 8 (Semi) Anadromous Tenualosa thibaudeaui Tenualosa toil
Obligatory lateral Obligatory lateral migration migration Non Non‐obligatory
lateral lateral migration migration
y p y p No significant longitudinal or lateral No significant longitudinal or lateral migrations. migrations.
Mainstream GUILD 7 GUILD 7 GUILD 6 GUILD 6
Includes anadromous and Includes anadromous and catadromous species. catadromous species. Vulnerable to damming. Vulnerable to damming.
7 Delta Resident Glossogobius giuris Polynemus longipectoralis
p 4 Floodplain Spawner Catlocarpio siamensis Puntioplites falcifer Hemibagrus spilopterus 5 Generalist Barbonymus gonionotus Labeo chrysophekadion W ll tt
GUILD 3 GUILD 3
Guild 4: Obligatory lateral Guild 4: Obligatory lateral migrations for spawning/ migrations for spawning/ feeding & refuge. Vulnerable feeding & refuge. Vulnerable to flood control to flood control
8 (Semi) Anadromous Tenualosa toil Lycothrissa crocodilus 9 Catadromous Macrobrachium rosenbergii Anguilla marmorata
Guild 5: Guild 5: Highly adaptable. Highly adaptable. Non Non‐obligatory lateral
- bligatory lateral
- migrations. Persists in
- migrations. Persists in
i d t i d t Barrier impacts low. Barrier impacts low.
Floodplain GUILD 7 GUILD 7 GUILD 7
Wallago attu
to flood control. to flood control. impoundments. impoundments.