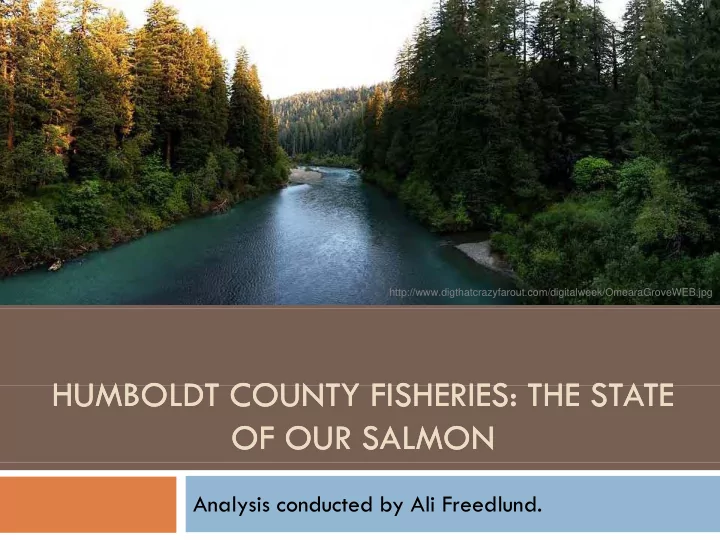

http://www.digthatcrazyfarout.com/digitalweek/OmearaGroveWEB.jpg HUMBOLDT HUMBOLDT COUNTY FISHERIES THE STATE HUMBOLDT HUMBOLDT COUNTY FISHERIES: THE STATE COUNTY FISHERIES THE STATE COUNTY FISHERIES: THE STATE OF OUR SALMON OF OUR SALMON Analysis conducted by Ali Freedlund.
Humboldt County Salmon Humboldt County Salmon y Humboldt County has the second and third largest y g salmon bearing basins in California Majority (over 50%) of Humboldt caught salmon Majority (over 50%) of Humboldt-caught salmon originated in the Sacramento River and over 1/3 of salmon landings in Eureka were estimated to come from the Klamath Many of our salmon stocks are considered Many of our salmon stocks are considered functionally independent Humboldt Count salmon are valuable in many ways H b ld C l l bl i North Coast Dialogues Fisheries Analysis
Questions Asked Questions Asked What is the current state of salmon stocks in What is the current state of salmon stocks in Humboldt County? What are the major threats to salmon? Wh h j h l ? What opportunities exist to protect or restore salmon pp p fisheries? North Coast Dialogues Fisheries Analysis
Where are the Coho? Where are the Coho? 18,000 16,000 on oho Salmo 14,000 12,000 10,000 Coho 1965 Coho, 1965 umber of C 8,000 Current run 6,000 4 000 4,000 Nu 2,000 0 Klamath Klamath Humboldt Bay Humboldt Bay Eel Eel Mattole Mattole North Coast Dialogues Fisheries Analysis
Chinook Numbers Chinook Numbers Chinook in Humboldt County s Two Largest Basins Chi k i H b ldt C t ' T L t B i 400,000 350,000 , k of Chinook 300,000 250,000 Number o Chinook historic run 200,000 1965 150,000 Current run 100,000 50,000 0 0 Klamath Eel River North Coast Dialogues Fisheries Analysis
Other Chinook Basins Other Chinook Basins 6000 nook 5000 ber of Chin 4000 Chinook run, 1965 3000 3000 Num Current run 2000 1000 1000 0 Redwood Creek Mad River Mattole North Coast Dialogues Fisheries Analysis
Steelhead Steelhead 300,000 250,000 ad of Steelhea Steelhead, 200,000 1965 Current Run 150,000 Number o 100,000 50,000 50 000 0 Klamath Klamath Redwood Mad River Redwood Mad River Eel Eel Mattole Mattole Creek North Coast Dialogues Fisheries Analysis
Threats to Salmon Threats to Salmon Degradation of Stream and Estuary Habitat Pollutants from storm-water runoff (pesticides, heavy metals, petroleum products, fertilizers and other agricultural wastes, etc.) High sediment loads Higher in-stream temperatures/climate change / Ocean conditions Predation: High ocean mortality Invasive species Dams and major diversions Unmonitored small diversions Over fishing Gravel Mining Deforestation for development Fish migration barriers North Coast Dialogues Fisheries Analysis
Changes in Stream and Changes in Stream and Estuary Habitat Estuary Habitat Estuary Habitat Estuary Habitat 1912 North Coast Dialogues Fisheries Analysis
Changes in Stream and Changes in Stream and Estuary Habitat Estuary Habitat Estuary Habitat Estuary Habitat 1944 North Coast Dialogues Fisheries Analysis
Changes in Stream and Changes in Stream and Estuary Habitat Estuary Habitat Estuary Habitat Estuary Habitat 1993 North Coast Dialogues Fisheries Analysis
Pollutants from storm Pollutants from storm- -water runoff water runoff “most stream quality indicators decline when most stream quality indicators decline when watershed impervious cover exceeds 10%, with severe degradation expected beyond 25%.” g p y North Coast Dialogues Fisheries Analysis
Opportunities Opportunities pp pp Removing the Klamath dams (and other fish migration barriers) g ( g ) Returning critical water to the Eel Monitoring other water diversions to ensure enough water for fish Ensuring essential habitat in estuaries/wetlands Incorporating storm-water filtration systems, green design materials and riparian setbacks in development designs. Continue to treat sediment sources and minimize impacts to Continue to treat sediment sources and minimize impacts to salmon from agriculture, gravel mining and forest management. North Coast Dialogues Fisheries Analysis
Watershed Restoration Watershed Restoration Between 1995 and 2002, Humboldt County generated more than $65 million for restoration. 2002 alone generated more than 300 new restoration jobs in the public, private and tribal sectors. North Coast Dialogues Fisheries Analysis
Conclusions Conclusions The more we can protect our forested landscape from p p development, the better for salmon survival. The more we can maintain or improve on water quality and quantity, the better for salmon survival. i h b f l i l The more we design water infiltration systems and use low impact green materials in construction, the better for salmon impact green materials in construction, the better for salmon survival. Klamath and Eel river dams are major impediments to recovering fisheries. The more we provide high-quality habitat (riparian setbacks and wetlands protections) the better for salmon survival and wetlands protections), the better for salmon survival. North Coast Dialogues Fisheries Analysis
Recommend
More recommend