
SLIDE 1
AREAS OF OPPORTUNITY Indicators of opportunity in selected NH towns - - PowerPoint PPT Presentation
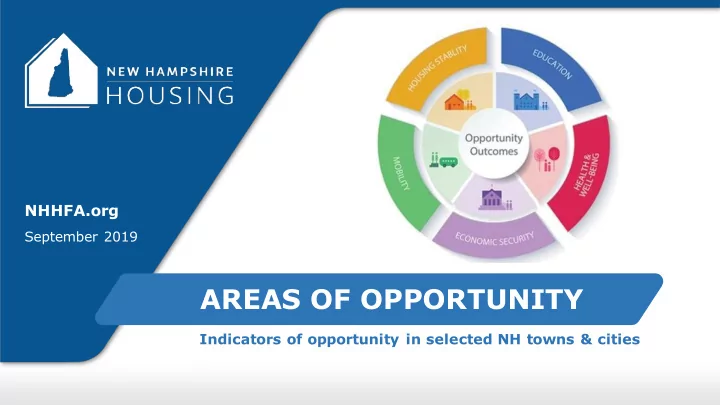
NHHFA.org September 2019 AREAS OF OPPORTUNITY Indicators of opportunity in selected NH towns & cities Purpose of Project This opportunity area comparison quantifies the level of opportunity in New Hampshire (as defined by the Opportunity
2
Areas of Opportunity
13
NAME OF PRESENTATION
14
NAME OF PRESENTATION