SLIDE 1 MOL2NET, 2018, 4, doi:10.3390/mol2net-04-xxxx 1 MDPI MOL2NET, International Conference Series on Multidisciplinary Sciences http://sciforum.net/conference/mol2net-03
Analysis of the enzymatic hydrolysis of sugarcane bagasse to obtain ethanol using a cocktail of native and commercial enzymes
Ángel Fernando Batallas Merino (fernadobatallas@outlook.es)a*, Carmen Amelia Salvador Pinos (pochasalvador@yahoo.com)b, Jonathan Fabricio Villavicencio (jfvm_1993@hotmail.com)a, Humberto González Gavilánez (hgonzález@uce.edu.ec)b, Erenio González Suárez (erenio@uclv.edu.cu)a
aUniversidad Central Marta Abreu de las Villas bUniversidad Central del Ecuador
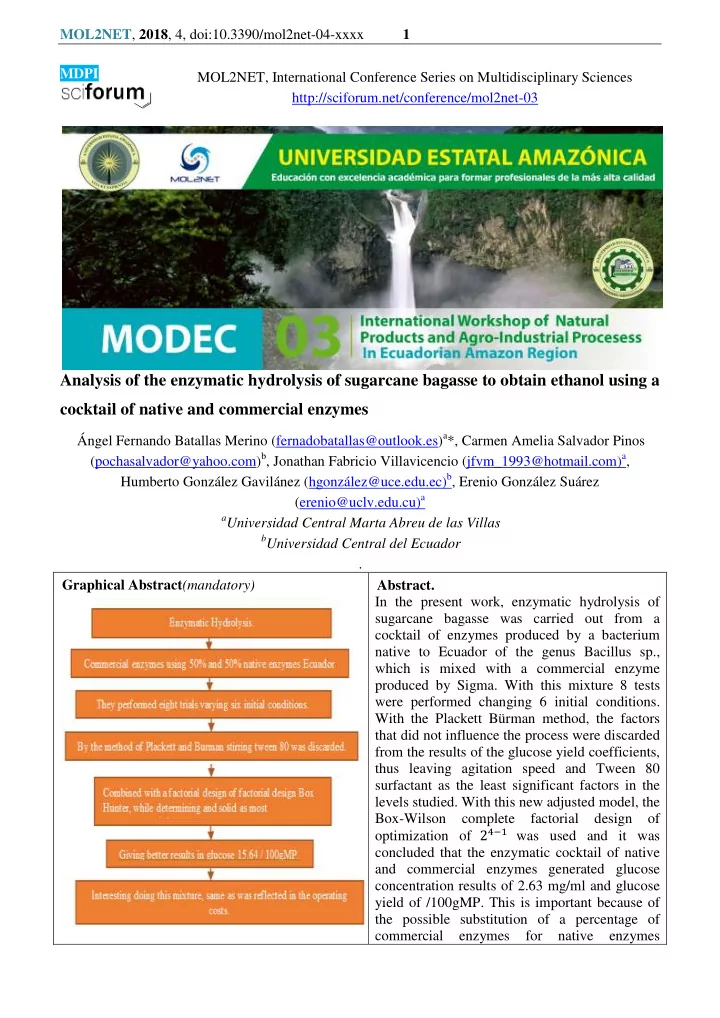
. Graphical Abstract(mandatory) Abstract. In the present work, enzymatic hydrolysis of sugarcane bagasse was carried out from a cocktail of enzymes produced by a bacterium native to Ecuador of the genus Bacillus sp., which is mixed with a commercial enzyme produced by Sigma. With this mixture 8 tests were performed changing 6 initial conditions. With the Plackett Bürman method, the factors that did not influence the process were discarded from the results of the glucose yield coefficients, thus leaving agitation speed and Tween 80 surfactant as the least significant factors in the levels studied. With this new adjusted model, the Box-Wilson complete factorial design
- f
- ptimization of was used and it was
concluded that the enzymatic cocktail of native and commercial enzymes generated glucose concentration results of 2.63 mg/ml and glucose yield of /100gMP. This is important because of the possible substitution of a percentage of commercial enzymes for native enzymes
SLIDE 2 MOL2NET, 2018, 4, doi:10.3390/mol2net-04-xxxx 2 reflected as an advantage in the operating costs. Keywords:enzymes, enzyme cocktail, ethanol, Bacillus sp., degradation, glucose Introduction The use of cellulose biomass continues to be a topic of global interest in view of the rapid depletion of
[1] and the high chemical energy potential
this raw material. Due to this problem, fuels that are generated from renewable sources have been sought, with ethanol being the one that has occupied an important place within these types o[2]f fuel. Ethanol produced by sources of lignocellulosic material has become an alternative to take advantage of the waste generated in the sugarcane industry, which is a process with high accessibility to the raw material, since there is no significant use of it and the cost of bagasse is relatively low [3]. For the production of ethanol with lignocellulosic materials to be considered commercially viable, it is important for the process to be economically sustainable. The stages that contribute most to the total cost are enzymatic hydrolysis and pretreatment. Pretreatment is necessary to increase the accessibility
- f cellulose by enzymes in enzymatic hydrolysis [4].
The greatest potential for the production of ethanol from biomass is found in the enzymatic hydrolysis
- f cellulose. The cellulase enzyme replaces the sulfuric acid in the hydrolysis stage and the
temperatures are from 30ºC to 50ºC, which reduces the degradation of the sugars . The enzymatic hydrolysis reaction is characterized by an insoluble substrate (cellulose) and a soluble catalyst (enzymes). Thus, the structural characteristics of the cellulose and the mode of action of the enzymes influence the reaction rate [5]. The susceptibility of cellulose to the enzymatic attack is determined by the accessibility of the binding sites for the cellulose, which determines the subsequent absorption of the enzyme on the solid substrate [6]. There are numerous commercial enzyme preparations that contain mainly cellulolytic activity [7]. These enzymatic preparations are obtained from microorganisms of fungal and bacterial origin, which mainly come from the microorganisms Penicillium sp.Trichoderma and Aspergillus, being these the most exploited source of celluloses and hemicelluloses [8]. Many of the research papers focus on the study of new enzymes, stemming from genetic manipulation or new sources of microorganisms [9]. When dealing with the production of enzymes with autochthonous bacteria, an interesting proposal is to replace a percentage of commercial enzymes, with enzymatic crudes produced in Ecuador, in order to obtain a mixture that minimizes the cost of the process of enzymatic hydrolysis of bagasse. A suitable way of analyzing the processes of degradation from enzymes is the experimentation with the support of experimental plans, in which the ideas presented on the combination of experimental tests have been proposed, and this increases the efficiency of the research. Defining those ideas as the amount of useful information that can be obtained per unit of experimentation cost [10]. It is logical to
SLIDE 3 MOL2NET, 2018, 4, doi:10.3390/mol2net-04-xxxx 3 think that the statistical methods of designing experiments have an undeniable validity since their two main objectives are: to minimize the number of tests and obtain the greatest amount of information. The following study has the overall aim: to evaluate the conditions that influence the process of enzymatic hydrolysis of a cocktail of native and commercial enzymes in Ecuador. Materials and Methods The conception of understanding part of the work scheme in which 50% of commercial enzymes will be replaced by 50% of native enzymes is assumed. For doing this, the conditions of the block diagram for the production of 500 hL/d of ethanol have been taken, eliminating the preferential stage, proposed by Albernas and others [11], as shown in Figure 1. Figure 1. Block diagram for the production of 500 Hl/d of ethanol, eliminating the pre-fermentation stage EXPERIMENTAL DESIGN To discard the factors that did not influence the laboratory-scale process, the Plackett-Bürman method [12] was used for multivariable systems with partial recesses for polynomials of the first degree of the method of Box and Hunter [13]. The combination of the Plackett-Bürman method with partial fractional designs has been applied in several works with satisfactory results that have served for the identification of some stages and systems of the process [14]. The method of Plackett-Bürman [15], is based on a highly fractional factorial design that studies all the possible variables that affect the system, and determine the most influential ones. It is considered an initial program to study the processes that have 5 variables and the research should be continued with a more rigorous plan, in order to find a more adequate model. The method is applicable with partial factorial designs, that "to shorten the number of tests, the vector
- f the column belonging to a matrix interaction that can be neglected, could be assigned to a factor"
[10].
SLIDE 4 MOL2NET, 2018, 4, doi:10.3390/mol2net-04-xxxx 4 According to this method, it is possible to study up to (n-1) variables with N tests; however, Isaacson recommends additional experiments to estimate the standard error and variance, due to experimental errors, interactions or quadratic effects. That is why false variables are included in the experimental plan. Results and Discussion In agreement with the proposed procedures, the best conditions of enzymatic hydrolysis of an enzymatic cocktail were determined starting from the similar experience reached by Bussamra and
- thers [16], including as response variables or dependent variables those listed below in Table1.
The glucose yield is the one that most affects the evaluation of the process and responds to how the hydrolysis process was carried out. This is because it is the measure that is directly related to the amount of cellulose that is degraded and because high performance liquid chromatography is used to measure it, which makes it sensitive and specific in relation to the other glucose measurement techniques such as DNS method [17]. The dependent response or variable parameters are described below: Dependent Variables Y1: Yield of glucose grams per 100 grams of raw material This is done in order to take advantage of the cellulose composition consisting of a polysaccharide formed by β-1,4glucosidic bonds[18]. Y2: Protein in liquor The objective here is to measure the peptides present in the hydrolysate, determined according to the Biuret assays, using 40 mg/l as standard of the concentration of fetal bovine serum [19] X1: Temperature (35ºC -50ºC). Enzymatic hydrolysis is carried out at the optimum temperature of the commercial enzyme, around 50 ° C, and decreases to 35 ° C because it has been shown that these enzymes have greater activity in that temperature range [4]. X2: Units of filter paper (UFP: 10-25 UPF / g) A cellulose concentrate (10 UFP / g dry base) has a positive effect on hydrolysis, to obtain better glucose yields. In addition, the literature indicates that an enzyme load of 25 UFP / g is the most indicated to achieve better glucose yields [20]. X3: Agitation, in rpm (150-200 rpm). It has been described that enzymes work better with agitation, projecting higher glucose yield results [4]. X4: Enzymatic reaction time (15-24 hours). Preliminary studies found good yields in a time of 24 hours. In addition [21], states that the best glucose yields are
in tests carried
between 8 and 72 hours. X5: Solid in percentages (5 and 8%).
SLIDE 5 MOL2NET, 2018, 4, doi:10.3390/mol2net-04-xxxx 5 According to theoretical studies, this is best executed in a semi-solid state. A study carried out in the analytical laboratory of renewable energy procedures gives results of glucose yields using a 2% w / v solids load [22]. A load of solids was maintained between 6 and 10% to achieve high yields [20].Other authors confirm a very acceptable yield using 5% w / v [23,24]. X6: Use of Tween 80 surfactant, (0.1 and 0.2 g). The literature cites that the incorporation of commercial surfactants in the enzymatic hydrolysis stage increases glucose yields in enzymatic hydrolysis up to about 20% [4]. The selection of the values of the variables that affect the system was generated from the saturated Plackett-Bürman partial fractional design (PB). Next, Table 1 is presented showing the experimental matrix of Plackett -Bürman [12] with the objective of determining the significance of each of the variables: Table 1. Plackett-Burman experimental matrix Variables X1 X2 Xf X3 X4 X5 X6 Tests 1 + + +
+ +
3 +
+ 4
+ + 5 +
+ +
+ +
7
+ +
- +
- 8
- In carrying out this design, the test that had the highest glucose yield is 1, as shown in Table 2. This
experiment corresponds to the use of 50 ° C, 25 UFP, 150 rpm, 5% solid and 0.1 g of Tween 80. This is possibly due to the effect that the commercial enzyme has on the enzyme crudes of the bacteria, because these data coincide with those recommended by SIGMA and that have been found in other studies with commercial enzymes [4]. For experimental plans of 8 tests, the first row of the matrix is: + + + + - + -- [15]. Table 2. Glucose concentration and yield for the enzymatic cocktail. Experiments Concentration of glucose (mg/ml) Glucose yield /100 grams of bagasse 1 2,63 15,64 2 1,64 10,46 3 0,47 2,36 4 0,41 6,27 5 0,80 6,90 6 0,21 9,64 7 0,10 2,16 8 1,37 6,36 From the data in Table 2, the performance coefficients detailed below were calculated in Table 3, selected from the Plackett-Bürman Matrix and the corresponding equation was applied, see Equation 1.
SLIDE 6 MOL2NET, 2018, 4, doi:10.3390/mol2net-04-xxxx 6 From it was found that the responses, E3 and E6 corresponding to agitation speed and Tween 80 were not statistically significant in the ranges evaluated on the response parameters in the cocktail hydrolysis under study. Table 3. Glucose yield coefficient for the enzymatic cocktail E1 E2 EF E3 E4 E5 E6 2,73 2,31
4,32
These results are possibly because the agitation speed does not allow hydrolysis to obtain a state of homogenization due to the physical characteristics of solidity shown by the bagasse cake under laboratory conditions or because the levels measured were not adequate. Regarding Tween 80, despite the fact that several studies recommend its use, it has been found [25], that by increasing the enzymatic load of cellulose up to 16 UFP/ g of pretreated substrate, the effect of Tween 80 on the enzymatic hydrolysis decreases. The experimental results allow determining the Equation 1 of the Plackett-Bürman method Equation 1 The Plackett-Bürman method allowed discarding variables X3 and X6 because they were not significant in the range studied. For the disintegration, the effects of the false variable were considered according to what is recommended by [12], where: The standard error is obtained by calculating the effect of false variables, estimated identical as, in the case of real variables, thus √
∑
Equation 2 The significance of each effect is verified by comparing the tabulated value of the student t to F /number of the false variables and the calculation of the expression. Equation 3 Then, if the calculated value is greater than the tabulated one, it means that the effect of the level variation of the independent variable really causes variations in the response parameter. And this is not due to experimental errors, which depends on the degree of significance of the variable, it is
- btained as it is significant: P = 80, 85, 90, 95% [10].
Once the variables were obtained, the tests were adjusted as proposed in an alternative combination of experimental designs by González and collaborators [10] using a plan by Box and Hunter (1961) [13], as a second design in its strategy of approaching the region of optimal results. The Factorial Design was proposed as observed in Table 4, with conditions adjusted to the experimental data obtained in the enzymatic hydrolysis experiments of the commercial enzyme Y= Eo+1/2[E1*x1+E2*x2+E3*x3+E4*x4+E5*x5+E6*x6]
SLIDE 7 MOL2NET, 2018, 4, doi:10.3390/mol2net-04-xxxx 7 cocktail and native Ecuadorian enzymes. (See Table 4.) A confusion factor of x5 = -x1x2 was used for this purpose. This will generate a relationship of 1= -x1x2x5 where: b1= β1 – β25, b2= β2 – β15, b4 = β4 –β14, b5 = β5 – β12, b24=β24 – β145, b45=β45 – β124 Table 4. Box-Hunter for commercial enzyme cocktail and native enzymes Ensayo Orden X1 X2 X4 X5 1 8 + + +
2 + +
4 +
4 5
+ + 5 7 +
+ 6 1
3
8 6
- The experimental results are shown in Table 5
Table 5. Factorial design for cocktail of commercial and native enzymes Test Y´ Y´´ Difference to the square Y Average 1 14,87 16,43 2,45 15,65 2 9,93 10,98 1,09 10,45 3 2,24 2,48 0,05 2,36 4 5,95 6,58 0,39 6,27 5 6,56 7,25 0,47 6,90 6 9,17 10,13 0,93 9,65 7 2,05 2,27 0,04 2,16 8 6,03 6,66 0,40 6,34 For the Box-Hunter model, Equation 2 was used, which is found below: Y = b0 b1 * x1 b2 * x2 b4 * x4 b5 * x5 b24 * x2x4 b45x4x5, Equation 2. The glucose yield coefficients of the enzymatic hydrolysis for the mixture of commercial enzyme with the enzymatic cocktail of bacterium Bacillus spp were evaluated using the Box-Hunter model, which are observed in Table 6. Table 6. Glucose yield coefficients of the enzymatic hydrolysis for the commercial enzyme mixture with the enzymatic cocktail of bacterium Bacillus spp. b1 b2 b4 b5 b24 b45 1,36 1,15 2,13
0,18 0,01 It was found that the factors Time (b4) and Percentage of solid (b5) are more significant than Temperature and Enzymatic load. Similar results were obtained by other authors when studying the effect of cellulose concentration (Celluclast CCN and Novozym TN 188) on the hydrolysis of 2% (w / v) of hydrothermally pretreated poplar in which they did not observe large differences in the percentages of conversion when they used concentrations between 15 and 25 UPF/g of cellulose. Similar results were obtained by García and collaborators [26].
SLIDE 8
MOL2NET, 2018, 4, doi:10.3390/mol2net-04-xxxx 8 The experimental results and the estimates of the Box-Hunter model are shown in Table 7 Table 7.Factorial design for cocktail of commercial and native enzymes. Test YpAvera ge Ye Equation Difference to the square Adequacy variance Sad=(Yp - Ye)2/GL 0.44 1 15,65 15,19 0,21 2 10,45 10,91 0,21 3 2,36 2,49 0,01 4 6,27 6,35 0,007 5 6,90 6,77 0,017 6 9,65 10,14 0,23 7 2,16 2,07 0,007 8 6,34 5,86 0,23 Reproducibilityvariance S(Y)2 =Σ(Y´- Y´´)2/8 0,53 According to these results, the calculated Fisher's test, Fc, 2.8 will be = 0.44/0.5354 = 0.82, which is smaller than the Tabulated F2.4 = 1.86 [27] and it is considered that the model is adequate to predict the results. Fermentative stage Results of separate hydrolysis and fermentation (SHF). The SHF fermentation step was carried out with the results of the test 1 which has the highest value in terms of glucose yield in 100g of bagasse. The test was carried out at 50 ° C, with an enzymatic load of 25 UPF, at 150 rpm, with 5% solids and 0.1% Tween 80. The hydrolysis was carried out in a period of 15 hours and the fermentation in a period of 24 hours. The glucose concentration values obtained in the selected test at 15 hours of enzymatic hydrolysis were 15.64 g per 100 g of bagasse, and based on the theoretical yield of 0.51 g of ethanol / g of glucose [4], it was obtained that there is 7.9 g of ethanol in 100g of bagasse. Conclusions 1) It is shown that, E3 and E6 corresponding to agitation speed and Tween 80 were not statistically significant since they showed low values, so it can be said that they did not interfere in the experiment. 2) The factors Time (b4) and Percentage of solid (b5) had more significance compared to the Temperature and Enzymatic load, indicating that the Time and the Percentage of solid are those that most influenced the results of the experiment, being this fact decisive when carrying out this process at an industrial level. 3) The model is adequate to predict the results obtained in Fisher's test = 0.8, which is lower than Tabulated F2.4 = 1.86. 4) These preliminary results have generated information that shows the feasibility of using the cocktail mixture in the bagasse hydrolysis to obtain ethanol because the mixture produces a glucose yield of 15,65 in 100 grams of bagasse.
SLIDE 9 MOL2NET, 2018, 4, doi:10.3390/mol2net-04-xxxx 9 References 1. Piñeiros, Y. Aprovechamiento de la biomasa lignocelulósica, algunas experiencias de investigación en colombia. In Aprovechamiento de la biomasa lignocelulósica, algunas experiencias de investigación en colombia, UTADEO: Bogota, 2014; pp 253-290. 2. Viñals Verde, M.B.G., Antonio; Michelena Álvarez, Georgina; Ramil Mesa, Marlen. Obtención de etanol a partir de biomasa lignocelulósica. ICIDCA 2012, 7-16. 3. Guarnizo, A.M., Pedro; Hoover , Albeiro. Pretratamientos de la celulosa y biomasa para la sacarificación. Scientia et Technica Año XV 2009, 284-289. 4. Mesa Garriga, L. Estrategia investigativa para la tecnologia de obtencion de etanol y coproductos del bagazo de la caña de azucar. Universidad Central Marta Abre de Las Villas, Santa Clara, 2010. 5. Albernas, Y.C., Gabriela; Mesa, Leyanis; Santos, Ronaldo; Gonzalez, Erenio. Estudio de la cinética de la hidrólisis enzimática del bagazo pretratado. AFINIDAD LXXII 2015, 127-132. 6. Abril, A.N., Enrique. Etanol a partir de biomasa lignocelulósica. Atleta Ediciones: Ecija, 2012. 7. Chacon, O. Preparativos de celulasas comerciales y aplicacionesen procesos extractivos. Universidad y Ciencias 2005, 111-120. 8. Mesa, L., Salvador , C. A., Herrer a , M., DAIMI, I., & González, E. . Celulasas por penicilium sp en diferentes condiciones de cultivo. Bioetanol 2015, 84-93. 9. Gomashe, J.G., P; Bezalwar, P. Isolation and screening of cellulose degrading microbes from nagpur region soil. Journal of life Sciences 2013, 291-293. 10. Gonzalez, E.R., Fernando; Ribot, Angel; Peralta, Luis. Combinacion de los metodos de diseño experimental en la minimizacion de los ensayos de una investigacion. Tecnología química 1986, 11-17. 11. Albernas, Y.C., Gabriela; Morales, Marlen; Gonzalez, Meilyn; Santos, Ronaldo; Gonzalez ,
- Erenio. Optimal desing for an ethanol plant combining first and second-generation
- technologies. Ciencia, Tecnologia y futuro 2014, 113-136.
12. Isaacson, W. Statistical analysis for multivariable systems chemical engineering. Chemical Engineering 1970, 67-74. 13. Box, G.H., J. The key k-y fractional factorial desing. Techometrics 1961, 333-340. 14. Ribot, A. Estudio preliminar del modelo matematico del refinador de discos simple. Tecnologia Quimica 1986, 11-17. 15. Plackett, R.B., J. The design of optimum multifactorial experiments. Biometrika 1946, 305- 325. 16. Bussamra, B.C., Freitas, S., Costa, A. Improvement on sugar cane bagasse hydrolysis using enzymatic mixture designed cocktail. Bioresource Technology 2015, 562-569.
SLIDE 10 MOL2NET, 2018, 4, doi:10.3390/mol2net-04-xxxx 10 17. Safari, A.E., Giti. The relative effects of some elements on the dns method in cellulase assay.
- Appl. Sci. Environ 2006, 93-96.
18. Cuervo, L.F., Jorge; Quiroz, Rosa. Lignocelulosa como fuente de azúcares para la producción de etanol. Biotecnologia 2009, 11-25. 19. Membrillo, I.S., Carmen; Menes, Marcos; Favela, Ernesto; Loera, Octavio. Particle geometry affects differentially substrate composition and enzyme profiles by pleurotus ostreatus growing
- n sugar cane bagasse. Bioresource Technology 2010, 211-220.
20. Peñuela, M.N., J; Becerra, M; Pereira N. Enzymatic hydrolysis optimization to ethanol production by simultaneus saccharification and fermentation. Biochem Biotechnol 2007, 141- 154. 21. Lin, L.Y., Rong; Liu, Yongqiang; Jiang, Wenju. In-depth investigation of enzymatic hydrolysis
- f biomass wastes based on three major components: Cellulose, hemicellulose and lignin.
Bioresource Technology 2010, 8217–8223. 22. Zhang, H.Y., Guangying ; Wei, Yutuo; Li, Xin; Zhang, Aiping; Xie, Jun. Enhanced enzymatic hydrolysis of sugarcane bagasse with ferric chloride pretreatment and surfactant. Bioresource Technology 2017, 396-404. 23. Buaban, B.I., Hiroyuki; Yano, Shinichi ; Tanapongpipat, Sutipa; Ruanglek, Vasimon; Champreda, Verawat; Pichyangkura, Rath; Rengpipat, Sirirat; Eurwilaichitr, Lily. Bioethanol production from ball milled bagasse using an on-site produced fungal enzyme cocktail and xylose-fermenting pichia stipitis. Journal of Bioscience and Bioengineering 2010, 18-25. 24. Rodrigues, A.G., M. Cellulase stability, adsorption/desorption profiles and recycling during successive cycles of hydrolysis and fermentation of wheat straw. Bioresource Technology 2014, 163-169. 25. Aswathy US, S.R., Deni L, Rani R, Pandey A. Bio-ethanol from waterhyacinth biomass: An evaluation of enzymatic saccharification strategy. Bioresource Technology 2010, 925-930. 26. Garcia, A.N., M; Ballesteros, Oliva, J; Gonzalez, A; Ballesteros, I. Effect of inhibitors released during steam-explosion pretreatment of barley straw on enzymatic hydrolysis. Appl Biochem Biotechnol 2006, 129-132. 27. Perry, R.C., Cecil. Chemical engineers handbook. Advisory Board: New York, 1975.