Agricultural Use of Manure and Biogas Effluent from Industrial- - - PowerPoint PPT Presentation

agricultural use of manure and biogas effluent from
SMART_READER_LITE
LIVE PREVIEW

Agricultural Use of Manure and Biogas Effluent from Industrial- - - PowerPoint PPT Presentation

Institute of Geoecology Agricultural Use of Manure and Biogas Effluent from Industrial- Scale Animal Operations The Chinese Experience Dr. Marco Roelcke Beijing, June 19, 2013 Traditional Chinese agriculture China carried out


slide-1
SLIDE 1

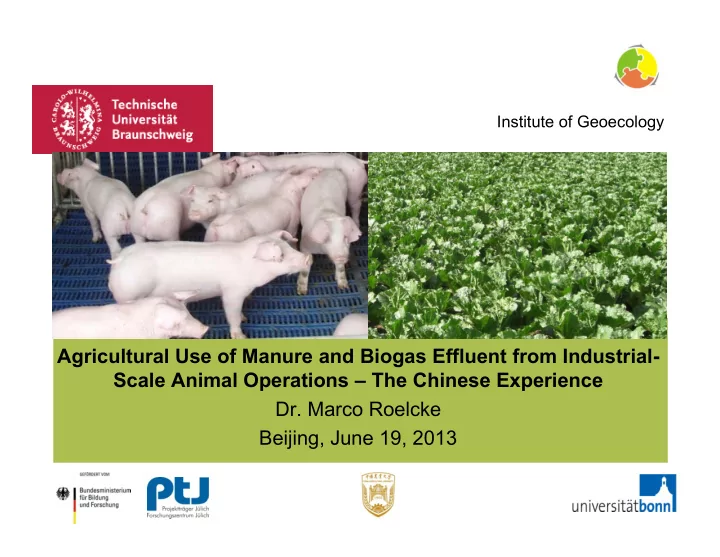
Agricultural Use of Manure and Biogas Effluent from Industrial- Scale Animal Operations – The Chinese Experience

  • Dr. Marco Roelcke

Beijing, June 19, 2013

Institute of Geoecology

slide-2
SLIDE 2

June 19, 2013 | Roelcke | Global Conference on Nutrient Management | Page 2

Traditional Chinese agriculture

  • China carried out sustainable agriculture for thousands of years (e.g. King, 1911)
  • Multicropping, intercropping, complex rotations, maximum nutrient recycling
  • Preserved soil structure, organic matter and nutrients, controlled weeds and pests
  • Without large anthropogenic imports, water pollution, or diminished productive

capacity

  • Sustained relatively high yields and dense human populations
  • Extremely high labour requirements caused social hardships for farmers
slide-3
SLIDE 3

June 19, 2013 | Roelcke | Global Conference on Nutrient Management | Page 3

Changes in the past 25 years

  • China’s land use and agricultural production have been undergoing rapid changes
  • Limited land base; loss of arable land
  • Over-supply with nutrients from mineral and organic sources
  • Very high mineral fertilizer application rates (esp. N)
  • Straw frequently burnt on the field
  • Systems transformed from a nutrient-limited to a nutrient-saturated state
  • Progressive de-coupling of plant production and animal husbandry
  • High nitrogen (N) deposition rates (60-70 kg N ha-1 yr-1 in Beijing region)
slide-4
SLIDE 4

June 19, 2013 | Roelcke | Global Conference on Nutrient Management | Page 4

  • In the peri-urban areas of Beijing livestock densities reach 10-15 livestock units

(LU) ha-1 (1 LU = 500 kg)

  • Pollution from livestock raising, wastewater is often dumped into rivers or canals
  • Soil pollution (HM, antibiotics)
  • Landless livestock farms – logistical problems due to surrounding small-scale

farmers

slide-5
SLIDE 5

Distribution of intensive pig production in China

Lu, H.Y., 2006

June 19, 2013 | Roelcke | Global Conference on Nutrient Management | Page 5

China slaughters nearly half (48.9% in 2009) of the world’s pigs About 30% of animals in China are being raised in large-scale

  • perations (2011)
slide-6
SLIDE 6

Biogas production potentials from animal wastes of large and medium sized livestock and poultry farms (2007)

Sino-Danish Renewable Energy Development Programme Report (2011) MOA statistics; China Animal Industry Yearbook, 2009

56% 28% 7% 5% 4%

pig milk cow beef cattle layer broiler

June 19, 2013 | Roelcke | Global Conference on Nutrient Management | Page 6

slide-7
SLIDE 7

Status quo of agricultural biogas plant of China

Dong, Guo, Clemens et al. (2010) Low temperature Poor supervision No monitoring of technology and performance efficiency

531 573 746 746 1171 1351 2124 2492 3556 5278 8572 15625 22570 Unit Years

Numbers of large and medium size agricultural biogas plant

18392.43 17619.1 22985.1 17260.1 29126.8 45507.8 66978.5 ×10,000m3 Years

Biogas production of large and medium size agricultural biogas plant

June 19, 2013 | Roelcke | Global Conference on Nutrient Management | Page 7

slide-8
SLIDE 8

Shunyi District in the Beijing Municipality

Pilot pig production farm

Research region

June 19, 2013 | Roelcke | Global Conference on Nutrient Management | Page 8

slide-9
SLIDE 9

Materials and Methods Shunyi District cropping structure

(2007)

June 19, 2013 | Roelcke | Global Conference on Nutrient Management | Page 9

slide-10
SLIDE 10

Pilot Pig Farm in Shunyi District

Centralized pig plant: Pig breeding (~ 12,000 pigs yr-1) Pig fattening (~ 20,000 pigs yr-1) ~ 9.5 ha cropland area “Ecological Feeding Gardens”: 160 households: ~ 140 fattening pigs yr-1 each ~ 0.2–0.33 ha cropland each ~ 25,000 fattening pigs yr-1 ~ 25.3 ha cropland area

June 19, 2013 | Roelcke | Global Conference on Nutrient Management | Page 10

slide-11
SLIDE 11

Current matter (nutrient and pollutant) fluxes on Pilot Farm

liquids solids

gan qing fen system 干清粪

  • Approx. 75%

June 19, 2013 | Roelcke | Global Conference on Nutrient Management | Page 11

slide-12
SLIDE 12

Hou et al., Journal of Anhui Agricultural Sciences, 2011

Phosphorus flow in centralized plant of Pilot Pig Farm (year 2009)

[kg P ha-1 yr-1]

June 19, 2013 | Roelcke | Global Conference on Nutrient Management | Page 12

slide-13
SLIDE 13

Hou et al., Journal of Anhui Agricultural Sciences, 2011

Phosphorus flow in “Ecological Feeding Gardens”

  • f Pilot Pig Farm (year 2009)

[kg P ha-1 yr-1]

June 19, 2013 | Roelcke | Global Conference on Nutrient Management | Page 13

slide-14
SLIDE 14

Composting

Pig faeces Corn stalks

  • Progress in composting process (mainly through application of straw):
  • NH3-N losses reduced from 40% to 8%.
  • GHG emissions (CO2 eq kg-1) reduced from 440 g kg-1 to 47 g kg-1.
  • Compost is a profitable market product
  • Compost can reduce the nutrient load in an area if exported to regions with soil nutrient and

SOM deficiency

  • Compost builds-up stable SOM, better than straw alone, esp. under sub-humid conditions
  • Compost, adequately prepared, can meet revised Chinese Quality Standard NY525-2011:

Moisture content ≤30% (total dry matter (DM) content ≥70%); (oDM) content ≥45%.

Guo et al., 2012; Jiang et al., 2011; 2013; Ren et al., 2010

June 19, 2013 | Roelcke | Global Conference on Nutrient Management | Page 14

slide-15
SLIDE 15

Shunyi and Huairou Districts cropping systems and hot spots

  • A. Ostermann

June 19, 2013 | Roelcke | Global Conference on Nutrient Management | Page 15

Heimann, 2013; Ostermann, 2013

slide-16
SLIDE 16

Shunyi and Huairou Districts cropping systems and hot spots

  • A. Ostermann

June 19, 2013 | Roelcke | Global Conference on Nutrient Management | Page 16

Heimann, 2013; Ostermann, 2013

slide-17
SLIDE 17

Soil nutrient and pollutant status

  • Soil sampling campaign in Shunyi and Huairou Districts over 3 years (2009-2011) (6 cropping seasons)
  • Soil types:
  • Eutric Cambisols (冲积物潮土) (冲积物褐潮土)
  • n alluvial deposits, with relictic hydromorphic characteristics
  • 5 cropping systems (double or multiple cropping):
  • winter wheat-summer maize
  • spring maize-Chinese cabbage,
  • vegetables
  • orchards
  • poplar plantations
  • 26 selected plots in sampled 0-200 cm in 6 depth increments
  • On hot spots: Soil corer sampling (0-400 cm)
  • Soil chemical analyses:
  • soil pH, CaCO3 contents
  • soil organic matter, DOC and DON
  • total and mineral/plant available macronutrients (N, P, K, S)
  • heavy metals (Cu, Zn, Cr, As)
  • antibiotics

June 19, 2013 | Roelcke | Global Conference on Nutrient Management | Page 17

Heimann, 2013; Ostermann, 2013

slide-18
SLIDE 18

Very high P inputs

2008/09

Heimann, 2013

June 19, 2013 | Roelcke | Global Conference on Nutrient Management | Page 18

slide-19
SLIDE 19

Very high P inputs

2008/09

Very high av. P contents in soils

Heimann, 2013 Available P [mg kg-1] 1981 2009 Wheat/maize 2-13 37 ± 31

  • Chin. Cabbage/maize

n.a. 115 ± 18 Vegetables n.a. 118 ± 79 Orchards n.a. 75 ± 49 Poplars n.a. 30

June 19, 2013 | Roelcke | Global Conference on Nutrient Management | Page 19

slide-20
SLIDE 20

2008/09 Plant available P contents in topsoils (0-20 cm)

24 agricultural fields in Shunyi and Huairou Districts of Beijing with different fertilization background

Olsen P: 74 mg kg-1 (mean value) Demand of crops in China: 10-20 mg kg-1 (Li et al., 2011) 11% of unmanured sites 60% of manured sites Exceeding threshold value of 60 mg kg-1 (Brookes et al., 1995)

Xue et al., J Soils Sediments, 2013

April 26, 2013 | Roelcke et al. | IRTG Final Symposium | Page 20

slide-21
SLIDE 21

Distribution of labile P through the whole soil profile (0-200 cm)

Soil phosphorus fractionation

160-200 120-160 90-120 60-90 20-60 0-20 100 200 300 400

Control soils Manure amended soils

Labile P (mg kg

  • 1soil)

Depth layer (cm)

Xue et al., J Soils Sediments, 2013

June 19, 2013 | Roelcke | Global Conference on Nutrient Management | Page 21

slide-22
SLIDE 22

P balance items Cropping systems Cereals

(n=21)

Orchards

(n=23)

Vegetables

(n=21) [kg P ha-1 yr-1] [kg P ha-1 yr-1] [kg P ha-1 yr-1]

Inputs Mineral fertilizer 111.3 89.8 59.6 FYM 3.9 59.1 617.7 Incorporated residues 13.1 2.6 Atmospheric P deposition 0.25 0.25 0.25 Total 128.6 151.8 677.6 Outputs Crop product 45.9 22.3 185.7 P Balance Surplus/deficit 82.7 129.5 491.8

Hou et al., Journal of Anhui Agricultural Sciences, 2011

Soil surface P balance for Shunyi District (2008/2009)

June 19, 2013 | Roelcke | Global Conference on Nutrient Management | Page 22

slide-23
SLIDE 23

P balance items Cropping systems Cereals

(n=21)

Orchards

(n=23)

Vegetables

(n=21) [kg P ha-1 yr-1] [kg P ha-1 yr-1] [kg P ha-1 yr-1]

Inputs Mineral fertilizer 111.3 89.8 59.6 FYM 3.9 59.1 617.7 Incorporated residues 13.1 2.6 Atmospheric P deposition 0.25 0.25 0.25 Total 128.6 151.8 677.6 Outputs Crop product 45.9 22.3 185.7 P Balance Surplus/deficit 82.7 129.5 491.8 Upscaling Shunyi District Sown area (year 2009) [ha] 21261.8 1220.9 4846.9 Total annual P surplus Shunyi District [t yr-1] 1758.4 158.1 2383.7

Hou et al., Journal of Anhui Agricultural Sciences, 2011

P surplus for Shunyi District (2008/2009)

June 19, 2013 | Roelcke | Global Conference on Nutrient Management | Page 23

slide-24
SLIDE 24

Life Cycle Assessment (LCA)

Integration of results from different subprojects:

  • Nutrient flows (N, P, K)
  • Gaseous nitrogen emissions (NH3, N2O)
  • Greenhouse gas emissions (CH4, N2O)
  • Energy flows

Luo et al., 2013

June 19, 2013 | Roelcke | Global Conference on Nutrient Management | Page 24

slide-25
SLIDE 25

LCA - Waste water management options

To utilize all nutrients and maximize export …

Waste water

Biogas plant Covered lagoon Cropland

Option 2

Waste water

Biogas plant Aeration pond, Open lagoon

75 % faeces Chicken m.

River

Current To utilize the waste water nutrients as much as possible…

Waste water

Biogas plant Aeration pond, Open lagoon

75 % faeces Chicken m.

Option 1

Cropland

To maximize biogas production without additional nutrients input…

Waste water

Biogas plant Covered lagoon

100 % faeces

Option 3

Cropland

Luo et al., 2013

slide-26
SLIDE 26

LCA Cropland demand [ha yr-1] for the biogas effluent Current over-fertilized and “balanced” cropland

With: 100% faeces to biogas 75% faeces 0% faeces Limited by: P demand P demand N demand

Year 1 to 5:

  • ver-fertilized system

(current situation): Nutrient application reduced by 50% (1/2 of crop demand) „Balanced“ system: Nutrient application according to crop demand If all faeces used for composting (Option 2), it is possible to export 23% of Ntot (currently 4%), 87% of P, 24% of K and 75% of Mg by compost Luo et al., 2013

576 476 168 288 238 139 100 200 300 400 500 600 700 Option 3 Option 1 Option 2 Area demand [ha yr-1] Year 1-5 Balanced

June 19, 2013 | Roelcke | Global Conference on Nutrient Management | Page 26

slide-27
SLIDE 27

LCA Eutrophication Potential (EP) of waste management system Current and Options 1-3

Luo et al., 2013

EP Current Option 1 Option 2 Option 3 75% faeces into biogas plant 75% faeces into biogas plant Effluent land application 0% faeces into biogas plant Effluent land application 100% faeces into biogas plant Effluent land application t PO4-Eq 91.7 56.0 34.1 68.0

June 19, 2013 | Roelcke | Global Conference on Nutrient Management | Page 27

Improvement of EP compared to Current system due to:

  • Enhanced nitrogen and phosphorus recovery
  • Utilization of effluent instead of discharge into lagoon and riverbed
slide-28
SLIDE 28

LCA Conclusions

1. If all faeces used for composting (Option 2), it is possible to export 23% of Ntot (currently 4 %), 87% of P, 24% of K and 75% of Mg by compost 2. As long as the cropland is over-fertilized 476 ha are necessary for sustainable utilization of the waste water nutrients at the current manure management (Option 1) 3. In a balanced fertilizer system with modified manure management (Option 2) “only” 139 ha cropland are necessary 4. Currently, the centralized pig plant only owns about 10 ha! 5. The use of biogas in a CHP plant is more profitable and sustainable than for external use for cooking and heating.

Luo et al., 2013

June 19, 2013 | Roelcke | Global Conference on Nutrient Management | Page 28

slide-29
SLIDE 29

Environmental economics

  • Quantitative farm household

survey (n=205) in a peri-urban village of Beijing (500 households; 1500 inhabitants; 320 ha farmland; pilot pig farm)

  • Data collection on the pilot farm

and biogas plant (“face-to-face”- interviews)

“The government should reduce environmental pollution and it should not cost me any money!” “Scientific results are interesting, but difficult to change, sometimes not realisable.”

  • Participatory workshop March 31, 2011

Lu et al, 2010; 2011; Ma, 2010

June 19, 2013 | Roelcke | Global Conference on Nutrient Management | Page 29

slide-30
SLIDE 30

Recommendations for remediation

Phosphorus, Potassium:

  • Establish optimum plant available P (Olsen) (10-30 mg kg-1, according to crops)

and available K (50-100 mg kg-1) contents in soil

  • Reduce excessive manure application to cash crops
  • P and K derived from FYM is sufficient in most cases
  • If FYM available, then apply some to cereal crops (basal fertilization)
  • Beginning acidification in topsoils  Reduce mobility of dissolved P in runoff or leachate by

adding amendments (such as CaCO3)

  • Reduce P content in manure by decreasing P content in feed

Nitrogen:

  • Reduce mineral and organic N fertilization
  • Nutrients applied (mineral and organic) should not exceed crop removal; Nmin method

Heavy metals and antibiotics:

  • Input reduction required. No routine use of HM and antibiotics as feed additives!
  • Risk assessment indispensable
  • Loading capacity of soil is limited

June 19, 2013 | Roelcke | Global Conference on Nutrient Management | Page 30

slide-31
SLIDE 31

Recommendations on technologies

Export of nutrients vs. improvement of biogas efficiency?

  • Export of nutrients in form of transportable and marketable fertilizers

 e.g. by composting the solid phase of animal excreta

  • If energy production as main aim, then high carbon (COD) content in liquid phase preferred

 but only C is reduced; more nutrients (NPK) remain in liquid phase or in digestate

  • High P and N recovery potential through struvite precipitation and ammonia stripping
  • Drying and pelletizing of digestate another option to transport nutrients
  • Decisions about technologies/recommendations must be region- and case-specific
  • Recommendations should be based on holistic view – animal production, crop farming,

energy production, etc. Recommendations for peri-urban areas in northern China:

  • Reduce very high nutrient surpluses and pollutants caused by animal husbandry
  • Reduce livestock density of 11 LU per ha in Shunyi District to 3-4
  • Nutrients from organic sources should be exported out of the peri-urban region in form of
  • rganic fertilizers, to outlying areas in the NCP lower in SOM and with less livestock
  • gan qing fen system is to be favoured
  • Storage basins should be sealed

June 19, 2013 | Roelcke | Global Conference on Nutrient Management | Page 31

slide-32
SLIDE 32

Policy options

Subsidy policy for anaerobic digestion (biogas plants):

  • In China, subsidies paid in relation to biogas plant investment rather than performance

 construction of numerous low-performing biogas plants.

  • Centralized electricity grid; low compensation
  • Progress may be made with a new feed-in or subsidize law oriented towards performance
  • New subsidy policy necessary similar to the German Renewable Energy Law (EEG)

Subsidy policy for compost production:

  • Governmental subsidies to compost production in place in several Chinese provinces.
  • For Beijing (2011): Subsidized price: 600 Yuan per ton;

Market price without subsidies: 120-350 Yuan per ton.

  • Composting being controversially discussed in China
  • Government should support economic manure treatment sites if it has the political will to

improve the current situation

  • Market price for quality fertilizer products likely to increase  good composting procedures
  • r high-end biogas plants may become economically attractive without subsidies in future.

June 19, 2013 | Roelcke | Global Conference on Nutrient Management | Page 32

slide-33
SLIDE 33

Policy recommendations

  • No specialization between crop farming and animal production, integrated systems in

agriculture would be preferable.

  • “Re-coupling” of animal and plant production needed
  • Chinese government should create an awareness and ask for an organic fertilizer concept

from the animal operation or the biogas plant before giving it environmental permission. Polluter Pays Principle:

  • The producer of waste/wastewater would be responsible for its treatment and utilization
  •  Equilibrium; as well as more balanced distribution of livestock densities
  •  Also conflict of interests, since the Polluter Pays Principle enforced by the government,

which at the same time wants to secure animal production

  • Feasible for intensive animal farms, not for small household-scale operations

June 19, 2013 | Roelcke | Global Conference on Nutrient Management | Page 33

slide-34
SLIDE 34

www.organicresidues.org

BMBF FKZ: 0330847A-H

  • Sept. 01, 2008 – March 31, 2012

MOST grant no. 2009DFA32710

  • Oct. 01, 2009 – Sept. 30, 2011

DAAD: 50117102 2010-2011