
SLIDE 1
AECOM June 2017
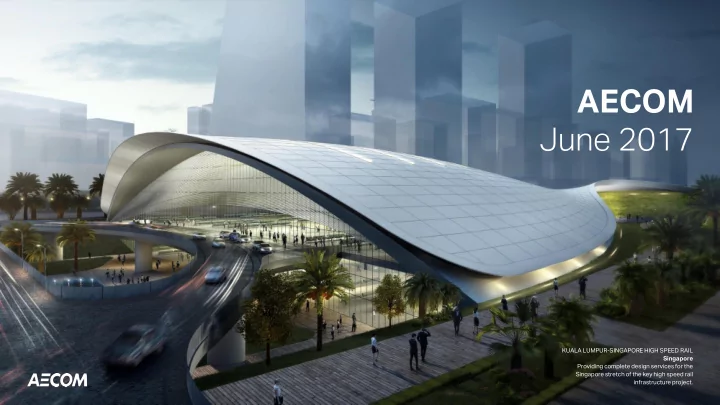
KUALA LUMPUR-SINGAPORE HIGH SPEED RAIL Singapore Providing complete design services for the Singapore stretch of the key high speed rail infrastructure project.
AECOM June 2017 KUALA LUMPUR-SINGAPORE HIGH SPEED RAIL Singapore - - PowerPoint PPT Presentation
AECOM June 2017 KUALA LUMPUR-SINGAPORE HIGH SPEED RAIL Singapore Providing complete design services for the Singapore stretch of the key high speed rail infrastructure project. Disclosures Safe Harbor Except for historical information
KUALA LUMPUR-SINGAPORE HIGH SPEED RAIL Singapore Providing complete design services for the Singapore stretch of the key high speed rail infrastructure project.
Page 1
Safe Harbor
Except for historical information contained herein, this presentation contains “forward-looking statements.” All statements other than statements of historical fact are “forward-looking statements” for purposes of federal and state securities laws, financial and business projections, including but not limited to revenue growth, earnings growth, operating and free cash flows, backlog, Management Services awards and award protests; any statements of the plans, strategies and objectives for future operations; any statements regarding future economic conditions or performance; any statements of belief; and any statements of assumptions underlying any of the foregoing. Forward-looking statements may include the words “may,” “will,” “estimate,” “intend,” “continue,” “believe,” “expect” or “anticipate” and other similar words. Although we believe that the expectations reflected in any of our forward-looking statements are reasonable, actual results could differ materially from those projected or assumed in any of our forward-looking statements. Our future financial condition and results of operations, as well as any forward-looking statements, are subject to change and to inherent risks and uncertainties, such as those disclosed in this presentation. Important factors that could cause our actual results, performance and achievements, or industry results to differ materially from estimates or projections contained in forward-looking statements include, among others, the following:
Additional factors that could cause actual results to differ materially from our forward-looking statements are set forth in our most recent periodic report (Form 10-K or Form 10-Q) filed and our other filings with the Securities and Exchange
Non-GAAP Measures
This presentation contains financial information calculated other than in accordance with U.S. generally accepted accounting principles (“GAAP”). In particular, the company believes that non-GAAP financial measures such as adjusted EPS, adjusted
impact of prior acquisitions and dispositions. We use free cash flow to represent the cash generated after capital expenditures to maintain our business. Our non-GAAP disclosure has limitations as an analytical tool, should not be viewed as a substitute for financial information determined in accordance with GAAP, and should not be considered in isolation or as a substitute for analysis of our results as reported under GAAP, nor is it necessarily comparable to non-GAAP performance measures that may be presented by other companies. A reconciliation of these non-GAAP measures to the most directly comparable GAAP financial measures is found in the attached appendix and in our earnings release on the Investors section of
When we provide our long-term, multi-year projections for adjusted EPS growth, organic revenue growth and free cash flow on a forward-looking basis, the closest corresponding GAAP measure and a reconciliation of the differences between the non-GAAP expectation and the corresponding GAAP measure generally is not available without unreasonable effort due to potentially high variability, complexity and low visibility as to items that would be excluded from the GAAP measure in the relevant future period.
37% 18% 17% 14% 10%4%
Diversified Market Exposure Full DBFO Capabilities Leading Cash Flow Performance Stockholder-Focused Capital Allocation
Free Cash Flow2 (millions) Total Debt Reduction (since close of URS transaction) Share Repurchases (since FY’11) M&A Transactions (since FY’11)
Page 2
% of TTM Revenues (as of FQ2’17)
Facilities Federal / Support Services Transportation Environment / Water Power / Industrial Oil & Gas $600 - $800 $677 $695 $298 $356 $370 FY'17E FY'16 FY'15 FY'14 FY'13 FY'12
% of TTM Revenues / TTM Adj. Op. Income1 (as of FQ2’17)
Design & Consulting Services Construction Services Management Services AECOM Capital
+ AECOM Capital
53% 11% 36% 43% 38% 19%
Post-URS
Key Stats
Page 3
2007: 2007:
Listed on the New York Stock Exchange
2008: 2008:
Ranked #1 design firm by ENR for first of eight consecutive years
2010: 2010:
Acquired Tishman to launch Construction Services
2011: 2011:
Mike Burke appointed President, Steve Kadenacy appointed CFO
2014: 2014:
Acquired Hunt to further bolster stadia/aviation construction expertise
2014: 2014:
Acquired URS to accelerate our DBFO vision and add leading government services capabilities
2007 2008 2009 2010 2011 2012 2013 2014 2015 2016 2017
2017: 2017:
Completed first AECOM Capital property sale, resulting in nearly 30% IRR
2013: 2013:
Mike Burke announced as CEO
2013 13:
AECOM Capital created as financing arm of DBFO strategy
Page 4
Los Angeles Rams ms Stadi dium um
San Onofre Nucle uclear Generati tion Stati tion
Range Support
Service ces (RSS) London Spire re
stadia construction capabilities acquired from Hunt and AECOM’s unparalleled scale
integrated nuclear decommissioning win
capabilities from MS, CS and DCS into a single
unique nuclear expertise acquired from URS
plus $3.6 billion award with the U.S. Air Force (currently under incumbent protest)
successful expansion of URS’s leading defense capabilities to deliver sizable projects as a prime contractor
construction of the largest residential building in Western Europe
accomplishment in diversifying Tishman’s vertical construction expertise into new markets
Scal ale e and d Diversif ersifica ication tion Leading ading to Larger, ger, More e Complex ex Wins ns
billion backlog
– Total backlog up 4%3 year-over- year, including record backlog in DCS Americas
past three quarters
– Includes the $3.6 billion U.S. Air Force award that occurred shortly after Q2 closed and is currently under incumbent protest
Recent Large Project Wins
20% 17% 16% 8% 6% 33% % of FY’16 Adj. Operating Income1 U.S. Private Infrastructure U.S. Transportation / Water Department of Defense Mission Critical / Other Agency U.S. Facilities / Environment International / Other Profit Exposure to Infrastructure, Defense and Mission Critical Markets
le $42 billion lion back cklog log provides several years
term rm fundin ing g as a result of substantial federal and state-level measures
le legisla lativ tive backdrop drop created by strong support for infrastructure and defense
ficant t exposur ure to attractive end markets, where we generate nearly 70% of our profits
Page 5
Record
nsporta
ecific ballot
tives es passed in
FAST Act now fully funded for 2017, providing clients with
confidence to advance large infrastructure projects
U.K.’s National Infrastructure Plan and the Inves esting ng in Cana nada da plan n providing significant international opportunities Califo forn rnia Road d Repair r and Accoun unta tability ty Act providing
significant transportation funding in one of our largest markets
Increme rementa ntal U.S. . defense nse spending g included in May budget
agreement for 2017 and sustained increases expected in FY’18
Global nuclea ear decommission
ng and deconta ntamina nati tion
Established Market Tailwinds
Organic Revenue Growth
infrastructure and federal markets
Adjusted EPS4 Growth
expansion
efficiencies
Cumulative Free Cash Flow2
ensuring long-term returns for shareholders CAGR CAGR
FY’17 – FY’21 Projections
Page 6
Poised sed to Ca Capitali italize ze on Ro Robust ust Mark rket et Opport
nities ies
Page 7
We have substantial momentum as a result of our Design, Build, Finance and Operate vision We are positioning for tremendous growth opportunities in our key infrastructure and defense markets where we generate nearly 70% of our profits We have established the foundation to deliver industry-leading growth and cash flow, including a10%+ adjusted EPS4 CAGR and $3.5+ billion of cumulative free cash flow2 (FY’17 – FY’21) We are unlocking stockholder value by executing on our vision and through continued debt reduction
2016 RIO OLYMPIC AND PARALYMPIC GAMES Brazil The global stage for the Games, the masterplan design makes virtue of dramatic, 120 hectare
complexity and continuity of work.
Page 9
1 Excluding intangible amortization and financial impacts associated with expected and actual dispositions of non-core businesses and assets. 2 Free cash flow is defined as cash flow from operations less capital expenditures net of proceeds from disposals. 3 On a constant-currency basis. 4 Defined as attributable to AECOM, excluding acquisition and integration related expenses, financing charges in interest expense, the amortization of intangible assets,
and financial impacts associated with expected and actual dispositions of non-core businesses and assets.
Proje ject t images (from top left): Rio Olympic & Paralympic Games, Brazil; Istanbul New Airport, Turkey; Olmsted Dam, PA, U.S.; Unmanned Aerial Systems Operation Center Support; Halley VI, Antarctica; Barclays Center, NY, U.S.; Taizhou Bridge, China; Spaceport America, NM, U.S.
infrastructure services firm
key categories, including U.S. and global design
complex and iconic projects
74% 12% 8% 6% U.S. EMEA Asia-Pacific Canada 44% 14% 30% 11% 1% Cost Plus Fixed Price (Design) GMP Fixed Price (Other) Hard Bid 52% 22% 15% 11% Private U.S. Federal U.S. State / Local Non-U.S. Governmnet
Page 11
% of TTM Revenues (as of FQ2’17) % of TTM Revenues (as of FQ2’17)
Funding Source Contract Type Geography
% of Contracted Backlog (as of FQ2’17)
Page 12
‡ During the first quarter of fiscal year 2017, a maintenance related operation previously reported within our CS segment was realigned within our MS segment to reflect present management oversight. Accordingly, to conform to the current period presentation approximately $33 million of revenue and $31 million of cost of revenue was reclassified for the quarter ended March 31, 2016. For the six months ended March 31, 2016, $66 million of revenue and $63 million of cost of revenue was reclassified.
Page 13
Six Months Ended Three Months Ended Mar 31, 2015 Sep 30, 2015 Dec 31, 2015 Mar 31, 2016 Jun 30, 2016 Sep 30, 2016 Dec 31, 2016 Mar 31, 2017
Net cash provided by (used in) operating activities $ 332.6 $ 431.8 $ 78.0 $ 113.2 $ 260.1 $ 362.9 $ 77.5 $ (46.1) Capital expenditures, net (55.6) (13.8) (0.8) (30.3) (68.8) (36.9) (21.0) (17.7) Free cash flow $ 277.0 $ 418.0 $ 77.2 $ 82.9 $ 191.3 $ 326.0 $ 56.5 $ (63.8)
Fiscal Years Ended Sep 30, 2012 2013 2014 2015 2016
Net cash provided by operating activities $ 433.4 $ 408.6 $ 360.6 $ 764.4 $ 814.2 Capital expenditures, net (62.9) (52.1) (62.8) (69.4) (136.8) Free cash flow $ 370.5 $ 356.5 $ 297.8 $ 695.0 $ 677.4