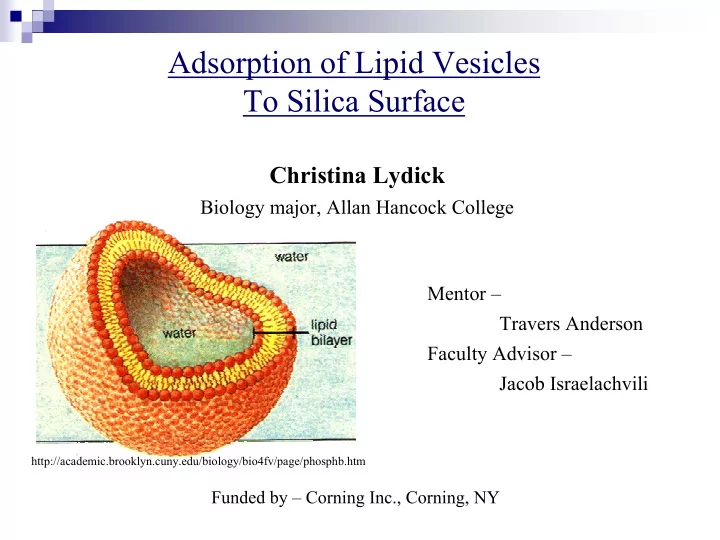
SLIDE 1 Adsorption of Lipid Vesicles To Silica Surface
Mentor – Travers Anderson Faculty Advisor – Jacob Israelachvili
Funded by – Corning Inc., Corning, NY
Christina Lydick
Biology major, Allan Hancock College
http://academic.brooklyn.cuny.edu/biology/bio4fv/page/phosphb.htm
SLIDE 2 ...then rupture…
Lipid Vesicles On Silica
…creating bilayers supported on a substrate.
Schonherr, H., et al. Langmuir, 20, 11600-11606 (2004)
Lipid vesicles adsorb…
50 nm
SLIDE 3 Supported Lipid Bilayers
- Cell membrane models
- To better understand actual cell membranes
- Biosensors
- Portable, inexpensive devices to test for diseases in
remote areas
Applications and uses:
SLIDE 4 Creating Vesicles
- Lipids come in vials in chloroform
- Evaporate chloroform while rolling vial
to create bilayer sheets
- Add buffered solution to vial
- Freeze/thaw to break sheets into vesicles
- Pass vesicle solution through extruder to
break down vesicles to 50 nm.
http://academic.brooklyn.cuny.edu/biology/bio4fv/page/phosphb.htm http://img.sparknotes.com/figures/A/a981208a1abd542364d5a13c08702881/phospholipid.gif
SLIDE 5 Adsorption Kinetics of Vesicles to Glass Surfaces
Rate at which vesicles adsorb Variables that affect this process
Vesicle concentration Salt concentration Temperature pH
Quartz Crystal Microbalance (QCM)
SLIDE 6 Quartz Crystal Microbalance (QCM)
vibrates as vesicles adsorb and then rupture
frequency of the vibrations
decay of oscillations
How it Works
Schonherr, H., et al. Langmuir, 20, 11600-11606 (2004)
SLIDE 7
Analyzing Results
∆m, adsorbed mass C, constant = 17.7 ng/Hz cm2 ∆f, frequency change n, overtone number = 3 (Depends on the resonant frequency being measured at)
Sauerbrey Equation ∆m = -C ∆f n
Experimental conditions: Temp: 30°C pH: 7.4 Solution: PBS, 150 mM NaCl
SLIDE 8
Analyzing Results
SLIDE 9
What Remains to be Done
Continue running experiments with the QCM to determine the best adsorption rate of vesicles when in a solution varying in:
Temperature: 15 – 40°C pH: 5 – 9 Salt concentration: 0 – 200mM
To determine the most efficient conditions to create supported lipid bilayers.
SLIDE 10
Acknowledgements
Travers Anderson, Mentor Jacob Israelachvili group INSET National Science Foundation (NSF) California Nanosystems Institute (CNSI) Corning Inc.
Special thanks to:
Samantha Freeman Julie Niles, AHC MESA director