a study on the optimal use of ramp up technique under
play

A Study on the Optimal Use of Ramp-up Technique Under Massive - PDF document

Transactions of the Korean Nuclear Society Virtual Spring Meeting July 9-10, 2020 A Study on the Optimal Use of Ramp-up Technique Under Massive Particle Condition with CMFD Acceleration Jaeuk Im, Namjae Choi, Han Gyu Joo * Seoul National


  1. Transactions of the Korean Nuclear Society Virtual Spring Meeting July 9-10, 2020 A Study on the Optimal Use of Ramp-up Technique Under Massive Particle Condition with CMFD Acceleration Jaeuk Im, Namjae Choi, Han Gyu Joo * Seoul National University, 1 Gwanak-ro, Gwanak-gu, Seoul, 08826, Korea * Corresponding author: joohan@snu.ac.kr 1. Introduction naturally increased by artificially upraised fission yields. What distinguishes the ramp-up schemes is the ramp-up PRAGMA is a GPU-based continuous energy Monte mode; namely, in which trend the population is increased. Carlo (MC) code dedicated for power reactor analyses Figure 1 shows the change of the number of particles in [1]. PRAGMA is capable of carrying out whole-core MC each cycle of several ramp-up modes. simulations with considerable quantity of particles – at least over 10 8 per cycle – in a reasonable time scale on a small cluster equipped with consumer-grade GPUs. At this rate of particles, the number of active cycles needed to obtain statistically acceptable solutions drops to dozens. However, the number of inactive cycles only depends on the dominance ratio of the problem. As the result, the number of required inactive cycles still stays at around 20 for typical power reactors, even when the CMFD acceleration is used [2]. It causes drastic increase in the computing time portion of the inactive cycles. Therefore, additional time-wise acceleration method other than the CMFD acceleration should be introduced to reduce the cost of inactive cycles in massive particle simulations. One of the typical acceleration scheme is the ramp-up scheme, which has been already introduced in several literatures [3, 4, 5, 6]. It gradually increases the Figure 1. Ramp-up modes: (a) step, (b) step-exponential (4 number of particles in the inactive cycles such that the steps), (c) step-exponential (8 steps), and (d) full exponential. amount of histories wasted to reach the converged source distribution is minimized. 2.2. Apparent Variance Analysis Paring CMFD acceleration and ramp-up scheme has not been considered before, as the CMFD acceleration A sensitivity test on the ramp-up schemes is performed requires sufficient amount of tallies to be stable, while for an APR1400 full-3D initial core problem [7] at HFP the ramp-up scheme minimizes the number of particles condition. The detailed specification of the computing in the inactive cycles. However, as PRAGMA targets to cluster that will be used is presented in Table 1 . deploy hundreds of millions of particles per cycle, still sufficient amount of histories to keep the CMFD stable Table 1. Computing cluster specification. is guaranteed with ramp-up. # of Nodes 3 Thus, in this paper, we will examine various ramp-up CPU / Node 2 × Intel Xeon E5-2630 v4 schemes, perform sensitivity tests, and find the optimal scheme under the massive particle condition paired with GPU / Node 4 × NVIDIA GeForce RTX 2080 Ti CMFD acceleration. By employing the optimal scheme, RAM / Node 8 × 16GB DDR4 RAM we will demonstrate a full-core simulation with massive Interconnect Mellanox Infiniband (56Gbps) number of particles achieving feasibility on a practical GPU cluster. Calculation conditions are shown in Table 2 . All the 2. Statistical Impacts of Ramp-up Schemes
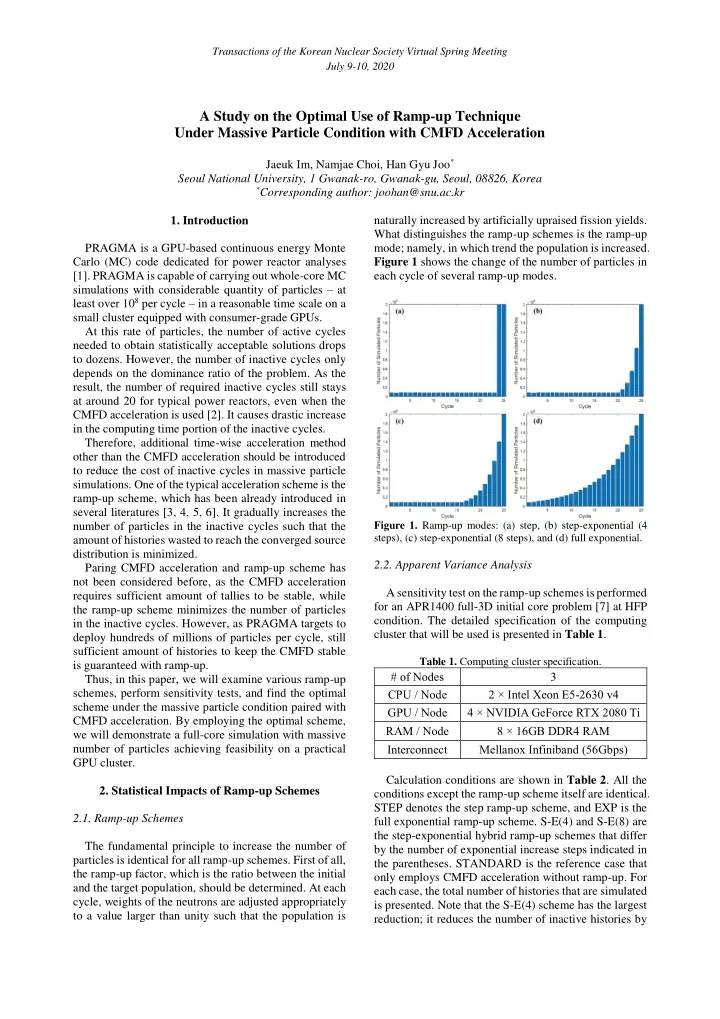
 conditions except the ramp-up scheme itself are identical. STEP denotes the step ramp-up scheme, and EXP is the 2.1. Ramp-up Schemes full exponential ramp-up scheme. S-E(4) and S-E(8) are the step-exponential hybrid ramp-up schemes that differ The fundamental principle to increase the number of by the number of exponential increase steps indicated in particles is identical for all ramp-up schemes. First of all, the parentheses. STANDARD is the reference case that the ramp-up factor, which is the ratio between the initial only employs CMFD acceleration without ramp-up. For and the target population, should be determined. At each each case, the total number of histories that are simulated cycle, weights of the neutrons are adjusted appropriately is presented. Note that the S-E(4) scheme has the largest to a value larger than unity such that the population is reduction; it reduces the number of inactive histories by

  2. Transactions of the Korean Nuclear Society Virtual Spring Meeting July 9-10, 2020 V : Volume of the i -th node about 90% compared to the STANDARD case. Even the i EXP scheme which is the most expensive one among the : The number of active fuel node N Act ramp-up schemes provides about 70% reduction. Table 3. Comparison of results from single run. Table 2. Calculation conditions. RMS / Max Power  Case Case Name k eff STAN STEP EXP S-E(4) S-E(8) Pin Cell Name DARD 1.00017 0.16% 0.84 % # of Particles STEP 200,000,000 (0.8) 0.47% 9.19 % per Cycle # of Inactive 1.00016 0.16% 0.83 % 25 S-E(4) Cycles (0.7) 0.41% 9.21 % # of Active 50 1.00019 0.16% 0.83% Cycles S-E(8) (0.6) 0.42% 9.26% # of Inactive 5.84E8 5.15E8 7.16E8 1.54E9 5.00E9 Histories 1.00016 0.16% 0.83% EXP CMFD On (Assembly-wise) (0.6) 0.42% 9.32% Ramp-up On (Factor of 25) Off 1.00015 0.16% 0.84% STANDARD (1.1) 0.42% 9.63% Figure 2 illustrates the Shannon entropy behavior as a function of the cumulative number of simulated histories for above cases. The vertical dash-line indicates the end of the inactive cycle for each case. It is noticed that the Shannon entropy converges normally in all cases, and no significant difference is observed after the convergence; all the schemes show very steady Shannon entropy trend. Figure 3. Pin power and apparent standard deviation (%) distributions. Figure 2. Shannon entropy behavior. Table 3 compares the apparent standard deviations of All the ramp-up schemes show comparable results for pin and unit cell (axial sub-volume in a pin) power tallies the apparent standard deviations with the STANDARD of different ramp-up schemes, and Figure 3 illustrates case. As far as the single run results are concerned, S-E(4) the distributions of pin power and its apparent standard should be the optimal choice whose computational cost deviation of each case. The RMS value of the apparent reduction is the largest. But it is not the case in reality. standard deviation is calculated as follows: Throughout all the results, it can be observed that the statistical impact of the ramp-up schemes cannot be seen by merely investigating the single run results. Shannon N    Act     2 (1) V V entropy is a collective quantity and cannot capture the A RMS , A i , i Act i local rebalance of the source distributions, and apparent  : Apparent standard deviation of the i -th node standard deviations are well-known to be biased by the A i , inter-cycle correlation of the fission source distributions   N Act : Active fuel volume V V [8]. Thus, it is necessary to examine the real variances. Act i i

  3. Transactions of the Korean Nuclear Society Virtual Spring Meeting July 9-10, 2020 Figure 4. Assembly and pin power real standard deviation (%) distributions. 2.3. Real Variance Analysis Table 4. Comparison of results from 20 independent runs. RMS / Max Power σ Case Name k eff σ Assembly Pin The real variances of the fission power were obtained 0.43% 0.46% from 20 independent runs for each case, whose results are STEP 1.13E-5 0.63% 0.86% presented in Table 4 . The distributions of assembly and 0.24% 0.30% pin power real standard deviations are also illustrated in S-E(4) 6.57E-6 0.35% 0.61% Figure 4 . The calculation conditions are the same with those used in the single run analyses. The RMS value of 0.20% 0.26% S-E(8) 7.99E-6 0.30% 0.57% the real standard deviation is calculated as follows: 0.12% 0.20% EXP 5.94E-6 0.19% 0.49% N    Act     2 (2) V V 0.11% 0.20% R, RMS R, i i Act STANDARD 5.62E-6 i 0.17% 0.47%  where is the real standard deviation of the i -th node, Comparison of results obtained from STEP and S-E(4) R i , defined as: shows the importance of a proper choice of the ramp-up mode. As indicated in Table 2 , S-E(4) has the smallest number of histories and thereby the largest reduction of N   1   S 2    (3) p P computational cost, followed by STEP. However, S-E(4) R i , ij i N 1 j has four steps of progressive population increase while S N STEP promptly creates all the neutrons. Such difference 1  S  : Sample-average power of the i -th node P p causes a substantial gap in the achieved uncertainty levels. i ij N j S That is, it is important to reserve cycles to ‘disperse’ the p : Power of the i -th node and the j -th sample neutrons that are additionally produced by ramp-up, as ij N : The number of samples they have highly correlated distributions due to localized S fission neutron productions by increased weights. The statistical impact of ramp-up to the active cycles, 3. Comprehensive Analysis Based on Figure of Merit which was not observed in single run results, is revealed by the differences in the real standard deviations. In case The combined effect of reduced computing time and of STEP, the RMS of real standard deviation of assembly increased uncertainty should be evaluated adequately to and pin power appeared to be about 3.9 and 2.3 times determine the optimal ramp-up scheme. Therefore, the larger than that of the STANDARD case, respectively. Figure of Merit (FOM) was used to obtain a quantitative On the other hand, EXP showed comparable statistical measure of the combined effect. The definition of FOM results with the STANDARD case. The hybrid schemes used in this study is as follows: showed intermediate behavior of STEP and EXP; more exponential steps resulted in less real standard deviations.

Download Presentation
Download Policy: The content available on the website is offered to you 'AS IS' for your personal information and use only. It cannot be commercialized, licensed, or distributed on other websites without prior consent from the author. To download a presentation, simply click this link. If you encounter any difficulties during the download process, it's possible that the publisher has removed the file from their server.

Recommend


More recommend