
SLIDE 1
A presentation by the Arlington County Department of Community Planning, Housing and Development, Planning Division Tri-State Transportation Campaign, November 15, 2013
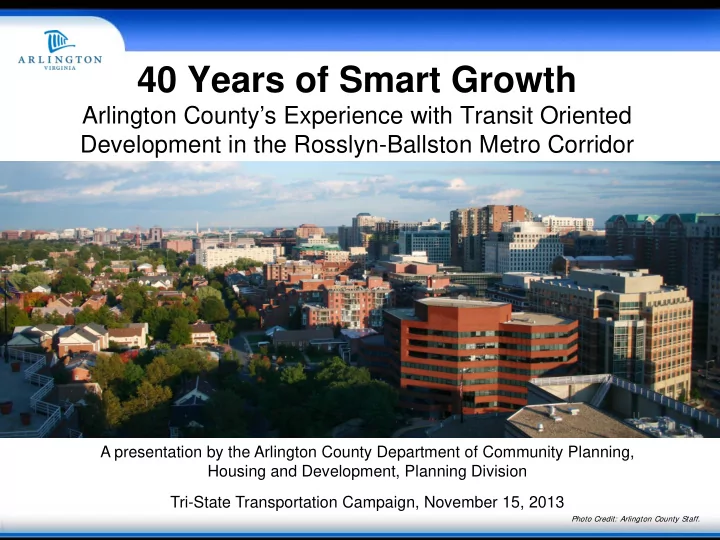
40 Years of Smart Growth
Arlington County’s Experience with Transit Oriented Development in the Rosslyn-Ballston Metro Corridor
Photo Credit: Arlington County Staff.