3 t ,t >. The graph of EXAMPLE 3: Consider the curve r t = - - PDF document

3 t t the graph of
SMART_READER_LITE
LIVE PREVIEW

3 t ,t >. The graph of EXAMPLE 3: Consider the curve r t = - - PDF document

SMOOTH AND UNSMOOTH CURVES Def. A curve C is smooth if it is traced out by a vector-valued function r ( t ), where r '( t ) is continuous and r '( t ) 0 for all values of t . t 2 > 3 EXAMPLE 1 : r t = < t , r ' t =


slide-1
SLIDE 1

SMOOTH AND UNSMOOTH CURVES

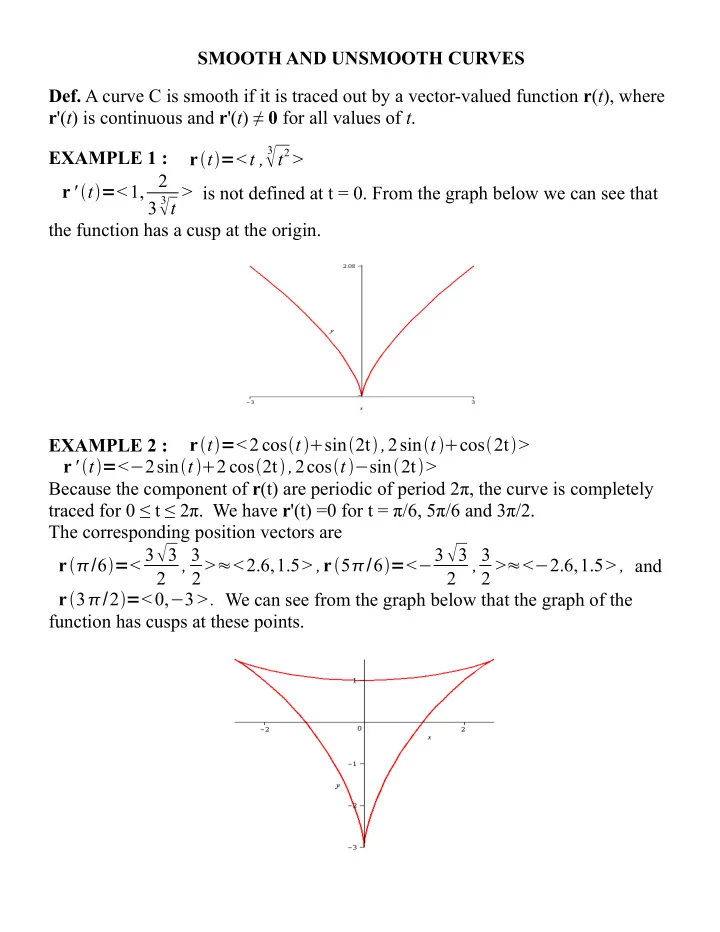
  • Def. A curve C is smooth if it is traced out by a vector-valued function r(t), where

r'(t) is continuous and r'(t) ≠ 0 for all values of t. EXAMPLE 1 : rt=<t ,

3

t2 >

r' t=<1, 2

3

3

t

> is not defined at t = 0. From the graph below we can see that the function has a cusp at the origin. EXAMPLE 2 : rt=<2 costsin2t ,2sintcos2t> r' t=<−2sint2 cos2t ,2cost−sin2t> Because the component of r(t) are periodic of period 2π, the curve is completely traced for 0 ≤ t ≤ 2π. We have r'(t) =0 for t = π/6, 5π/6 and 3π/2. The corresponding position vectors are r/6=< 33 2 , 3 2 >≈<2.6,1.5> ,r5/6=<−33 2 , 3 2 >≈<−2.6,1.5> , and r3/2=<0,−3 >. We can see from the graph below that the graph of the function has cusps at these points.

slide-2
SLIDE 2

EXAMPLE 3: Consider the curve rt=<5sin

3t ,5cos 3t ,t >. The graph of

the curve is shown below. It looks like the graph has “sharp corners” or “edges”. However, by zooming in on the edges, we can see that the curve is actually

  • smooth. Note that

r' t=<15sin

2t cost ,−15cos 2tsint ,1> , thus r'(t)≠ 0 for all t-values.

slide-3
SLIDE 3

EXAMPLE 4: Consider the curve rt=<cost ,t

2e −t ,cos 2t >.

We have r' t=<−sint ,t e

−t 2−t ,−2cost sint > , and r'(t) = 0 for t = 0.

The corresponding position vector is r(0) = < 1, 0, 0> and we can see that the graph has a cusp at this point.