
SLIDE 1
2017 Water Cruise: Update on Cyanide Rolling Averages # Sites - - PowerPoint PPT Presentation
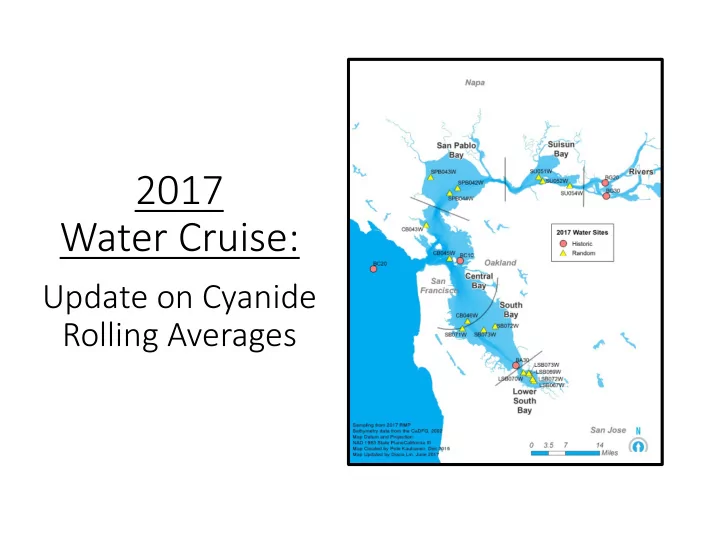
2017 Water Cruise: Update on Cyanide Rolling Averages # Sites With Results by Year & Region Suisun San Pablo *Central **South Lower South Bay Bay Bay Bay Bay Cyanide 2013 3 3 4 1 5 2015 3 3 4 4 5 (total) 2017 3 3
(total)
*Historical station BC10 included; **Historical station BA30 included
Suisun Bay San Pablo Bay *Central Bay **South Bay Lower South Bay 2013
3 3 4 1 5
2015
3 3 4 4 5
2017
3 3 4 4 5
Total Samples in Rolling Average
9 9 12 9 15
Region Cyanide TL (μg/L) Previous Average (μg/L) (2011, 2013, 2015) Current Average (μg/L) (2013, 2015, 2017) Δ Rolling Average Distance From TL Suisun Bay 1 0.45
0.34
0.66
San Pablo Bay 1 0.48
0.38
0.62
Central Bay 1 0.37
0.40 0.03 0.60
South Bay 1 0.43
0.40
0.60
Lower South Bay 1 0.40
0.37
0.63