
SLIDE 1
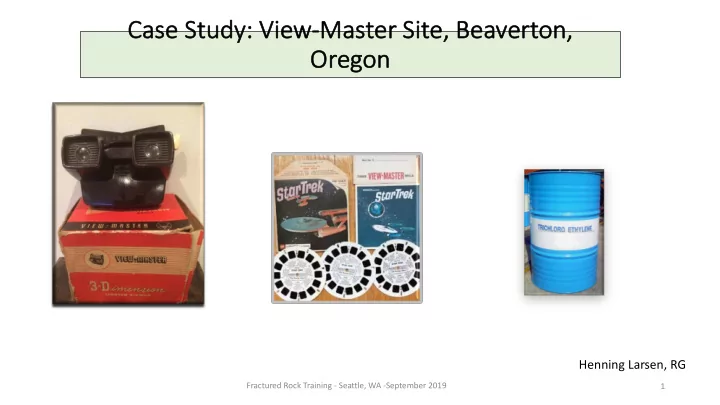
Case Study: y: View-Ma Master er Site, e, Bea eavert erton, Or Oregon
Henning Larsen, RG
Fractured Rock Training - Seattle, WA -September 2019 1
Case Study: y: View-Ma Master er Site, e, Bea eavert erton, Or - - PowerPoint PPT Presentation
Case Study: y: View-Ma Master er Site, e, Bea eavert erton, Or Oregon Henning Larsen, RG Fractured Rock Training - Seattle, WA -September 2019 1 View-Master Site, Beaverton Oregon Site Site Fractured Rock Training - Seattle, WA
Fractured Rock Training - Seattle, WA -September 2019 1
Fractured Rock Training - Seattle, WA -September 2019 2
Fractured Rock Training - Seattle, WA -September 2019 3
28,000 21,000 9,000 65,000 2,800
2/ND/6 7/3/16 86/524/50 62/215/100 1/6/9 TCE Source Areas TCE (ug/L) Facility Boundary TCE/cis-DCE/Total Cyanide (ug/L)
28,000 86/524/50
Fractured Rock Training - Seattle, WA -September 2019 4
Fractured Rock Training - Seattle, WA -September 2019 5
Fractured Rock Training - Seattle, WA -September 2019 6
800 ft
380 ft 275 ft
Fanno Creek
160 ft Anticline 600 ft
Fractured Rock Training - Seattle, WA -September 2019 7
Fractured Rock Training - Seattle, WA -September 2019 8
Palouse Canyon, the Sentinel Bluffs flows of the Grand Ronde Formation are seen on the bottom, covered by the Ginkgo Flow of the Wanapum Basalt.
Fractured Rock Training - Seattle, WA -September 2019 9
Fractured Rock Training - Seattle, WA - September 2019 10
Discharge of saline groundwater
Fractured Rock Training - Seattle, WA -September 2019 11
Willamette Silt CRB Flow Top
TCE Plume
Fractured Rock Training - Seattle, WA -September 2019 12
Willamette Silt CRB Flow Top
Fractured Rock Training - Seattle, WA -September 2019 13
Willamette Silt CRB Flow Top
Fractured Rock Training - Seattle, WA -September 2019 14
Fractured Rock Training - Seattle, WA -September 2019 15
1.5 ft drawdown contour within Block E
No Response In Block C
No Response in Block D
Extraction Well
4 ft drawdown
Estimated 120 gpm groundwater inflow based on average gain of Fanno Creek
Fractured Rock Training - Seattle, WA -September 2019 16
Fractured Rock Training - Seattle, WA -September 2019 17
130 ft vertical separation between DMW-2A and DMW-2C
NS 6,740/190 29/66 ND/ND 4/81 4,070/NA
TCE Plumes in CRBG-A
Highest concentration of last four events: 29/66 - TCE (ug/L)/ Total Cyanide (ug/L),
Estimated Capture Zone - 2001 FS Extraction Wells Average Flow – Initial/Current (gpm)
376/63 ND/8 ND ND 4,510 3,100 ND 12,000 1,280 1,540 6.5
Fractured Rock Training - Seattle, WA -September 2019 18 10/5 5/0 100/54 90/62 5/0
Fractured Rock Training - Seattle, WA -September 2019 19
Fractured Rock Training - Seattle, WA -September 2019 20
Fractured Rock Training - Seattle, WA -September 2019 21
Fractured Rock Training - Seattle, WA -September 2019 22