1 Reduce Noise Level Accelerometer Board Filtering hardware - - PDF document

1
SMART_READER_LITE
LIVE PREVIEW

1 Reduce Noise Level Accelerometer Board Filtering hardware - - PDF document

Health Monitoring of Categories of WSN Applications Civil I nfrastructures Using W ireless Sensor Netw orks Monitoring environments Great duck island, Redwood forest Focus on low-duty cycle and low power consumption Monitoring


slide-1
SLIDE 1

1

Health Monitoring of Civil I nfrastructures Using W ireless Sensor Netw orks

Chenyang Lu CSE 520S

  • S. Kim, S. Pakzad, D. Culler, J. Dem mel, G. Fenves, S. Glaser,

and M. Turon, Health Monitoring of Civil Infrastructures Using Wireless Sensor Networks, IPSN, April 2007.

2

Categories of WSN Applications

Monitoring environments

  • Great duck island, Redwood forest
  • Focus on low-duty cycle and low power consumption

Monitoring objects – High Fidelity Sampling

  • Machine health monitoring, earthquake monitoring,

structural health monitoring

  • Focus on fidelity (quality) of sample

Interacting with space and objects

  • Lighting control
  • Focus on control

3

Structural Health Monitoring

Two Damage Detection Approaches: direct (visual inspection, x-ray, etc.) indirect (detecting changes in structural properties/ behavior) Two Major Categories disaster response (earthquake, explosion, etc.) and continuous health monitoring (ambient vibrations, wind, etc.).

4

Traditional Approach vs. WSN

cost of equipment is high installation is very expensive due to wiring maintenance is expensive WSN provides the same functionality at a much lower price higher spatial density

  • $600 per point compared to thousands of dollars

for a data point in traditional sensor networks

5

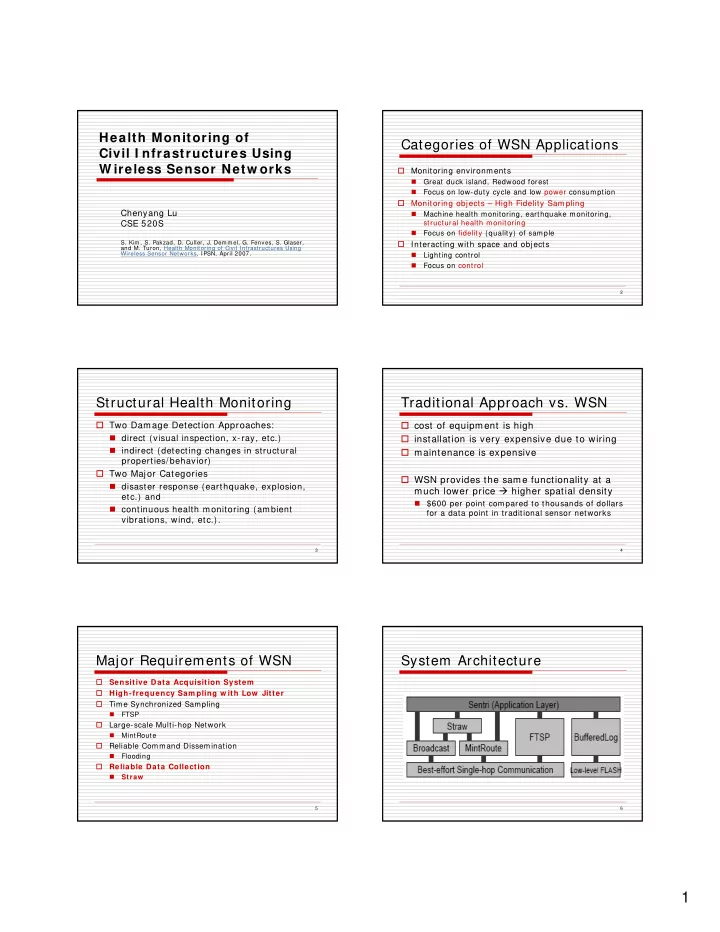
Major Requirements of WSN

  • Sensitive Data Acquisition System
  • High-frequency Sam pling w ith Low Jitter
  • Time Synchronized Sampling
  • FTSP
  • Large-scale Multi-hop Network
  • MintRoute
  • Reliable Command Dissemination
  • Flooding
  • Reliable Data Collection
  • Straw

6

System Architecture

slide-2
SLIDE 2

2

7

Accelerometer Board

Top two: ADXL202E Bottom two: Silicon Design 1221L 16-bit ADC

8

Reduce Noise Level

Filtering

  • hardware single-pole -6db low-pass filter with a

cutoff frequency of around 25Hz

Oversampling

  • ADC much faster than sampling frequency
  • allow oversampling and averaging
  • desired sampling rate 200Hz
  • real sampling rate 1KHz

9

Accelerometer Board (more)

  • Thermometer
  • for calibration
  • accelerometers are

sensitive to temperature

  • Voltage Regulator
  • 3V to the mote
  • 5V to the accelerometer

board

  • constant voltage essential

for the calibration of the accelerometers

10

Power Consumption

  • The accelerometer board consumes about twice the

energy as the mote.

  • Only the mote should be directly connected to the battery

and turn on/ off the other components.

11

Calibration (important!)

Board placed in an underground vault to measure static noise floor. Tilt test process at different angles.

  • SiliconDesigns 1221L saturates at + / - 150 mG
  • ADXL202 ranges + / -2G

Shake bed tests (0.5Hz ~ 8Hz) verifies dynamic performance Oven test for temperature calibration

  • Chips not only sensitive to temperature, but also to

temperature change

12

iMote2 Calibration on a Beam -WUSTL

2 4 6 8 10 12 −0.2 −0.15 −0.1 −0.05 0.05 0.1 0.15 Free vibration Time Amplitude WIRELESS SENSORS WIRED SENSOR

slide-3
SLIDE 3

3

13

Jitter

Spatial: between different nodes

variation in crystals Flooding Time Synchronization Protocol [ FTSP] is adequate

Temporal: different samples in a node Temporal jitter > spatial jitter in high frequency sampling

14

Analysis of Jitter

Sampling Other jobs like EEPROM write Non-preemptible portion Preemptible portion Probability Jitter C W T1+ C T2+ C P1/ T1 P2/ T2 Time

  • C: context switch time
  • Ti: length of atomic section i
  • W: CPU wake up time

15

Jitter Measurement

16

Reduce Jitter

MicroTimer: async timer in Khz Turn off all external component except FLASH during sampling

  • worst case jitter is determined by the longest

atomic section

  • avoid atomic sections from other components

17

Reduce Jitter

Atomic sections are unavoidable on a single microcontroller. Reduce jitter

  • turning off unnecessary components reduce

number of atomic sections

  • faster microcontroller shorten atomic sections
  • Test-and-set instruction shorten atomic sections

May eliminate jitter by using a separate microcontroller to sample sensors.

18

Reliable Data Collection

SHM requires 100% data delivery Challenges

  • Unreliable links
  • Interference

Straw: Scalable Thin and Rapid Amassment

  • Lossless data collection protocol
slide-4
SLIDE 4

4

19

Straw

Receiver initiated Selective NACKs Rate of transmission determined by sender’s distance to base station

Max 5 hops to allow pipelining Based on measured interference range

20

Reliable Data Collection at GGB

Bandwidth versus Hop Count

200 400 600 800 1000 1200 1400 10 20 30 40 50 Hop Count Bandwidth (B/s)

Aug 1st Aug 7th Sep 20th Data is collected reliably over a 4 6 -hop netw ork, w ith a bandw idth of 4 4 1 B/ s at the 4 6 th hop

21

Adjusting Packet Size

Increase packet size

  • reduces header overhead
  • higher loss rate and retransmission cost

Doubling the packet size to 72B double the bandwidth in the test

  • Optimistic because the test was done in the lab

with 99.8% delivery success rate

22

The Golden Gate Bridge

23

Deployment

8 nodes 51 nodes

1125 ft 4200 ft 500 ft 246 ft

SF (south) Sausalito (north)

Distance between nodes on the span is 100ft or 50ft Initially designed as 150ft

  • Difference in MicaZ radio output power

was up to 7.5dBm

24

Environment

Fog Strong and salty wind Rapidly changing ... high and scary

slide-5
SLIDE 5

5

25

Node

Node (Mote + Accelerometer Board) Battery (4 X 6V Lantern Battery) Bi-directional Path Antenna

26

Node

Extreme Rusting of C-clamp Zip tie around Antenna

27

Base Station

Laptop Students At Work

28

Installation

Hard Hat Harness Sharp Edge Ouch However… Crawling and Installing Done! Strong Wind

29

Vibration Data

100 200 300 400 500 600

  • 20

20 Time (sec) Accel (mg) Time and Frequency plots, Vertical sensors, s284n62 45 50 55 60 65

  • 5

5 Time (sec) Accel (mg) 5 10 15 20 25 30 35 40 45 50 1 2 frequency (HZ) PSD (mg/Hz) 0.5 1 1.5 2 2.5 1 2 frequency (HZ) PSD (mg/Hz) 100 200 300 400 500 600

  • 50

50 Time (sec) Accel (mg) Time and Frequency plots, Vertical sensors, s284n45 45 50 55 60 65

  • 10

10 Time (sec) Accel (mg) 5 10 15 20 25 30 35 40 45 50 2 4 frequency (HZ) PSD (mg/Hz) 0.5 1 1.5 2 2.5 2 4 frequency (HZ) PSD (mg/Hz)

Vertical Sensor at quarter-span 365m North of the South Tower Vertical Sensor at quarter-span 335m South of the North Tower

Peak at 0.11Hz matches the fundamental frequency

  • f the bridge in the past studies

30

Vibration Data

The vertical m odal properties m atch am ong ( 1 ) sim ulation m odel, ( 2 ) previous study, and ( 3 ) this study

slide-6
SLIDE 6

6

31

Conclusion

  • 59 nodes over the span and the tower
  • 100ft apart due to radio range
  • collecting ambient vibrations in two directions

synchronously at 1KHz rate

  • Sampled data collected reliably over a 44 hop network
  • 461B/ s at the 44th hop for reliable transmission
  • less than 10μs jitter ( max 6.67KHz sampling rate)
  • accuracy of 30μG
  • Collected data agrees with theoretical models and

previous studies of the bridge.

32

Bonus – Spectacular Views

33

Future Work

  • Increase packet size without affecting reliability and

transmission cost.

  • Design better power circuit for accelerometer board.
  • less energy would be consumed if sensors could be

turned off by mote when not sampling

  • Additional microcontroller on the board
  • make real-time sampling easier
  • require more complex accelerometer board design.

34

More? Critique?

Sensor calibration is crucial. Verify sampling rates and jitter. Energy harvesting, e.g., solar panels.

35

MR damper Wireless sensor

Wireless Structural Control - WUSTL

36

Acknowledgement

  • Some slides borrowed from Sukun Kim’s doctoral

defense at UCB, Fei Sun’s slides at WUSTL sensor networks seminar, Shirley Dyke, and Nestor Eduardo Castaneda Aguilar.