1
play

1 PRE PRE OVERWEIGHT PATIENT WITH VISCERAL ADIPOSITY DIABETES - PDF document

Type 2 diabetes: Type 2 diabetes: LE PREDIABETE vascular vascular complications complications a at diagnosis t diagnosis 2030% diabetic retinopathy 1020% microalbuminuria DIABETOLOGIST 3040% hypertension 5080%


  1. Type 2 diabetes: Type 2 diabetes: LE PREDIABETE vascular vascular complications complications a at diagnosis t diagnosis • 20–30% diabetic retinopathy • 10–20% microalbuminuria DIABETOLOGIST • 30–40% hypertension • 50–80% dyslipidaemia Pr. Selim Jambart Chef du Service d’Endocrinologie et des Maladies Métaboliques Hotel Dieu de France
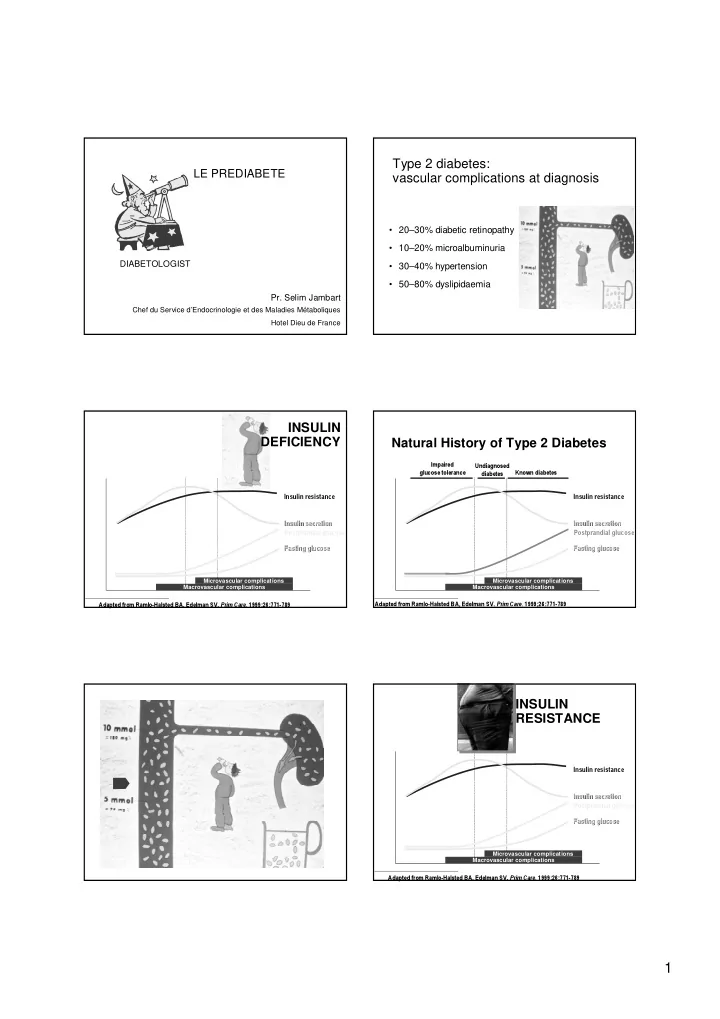
 INSULIN INSULIN DEFICIENCY DEFICIENCY Natural History of Type 2 Diabetes Natural History of Type 2 Diabetes Impaired Impaired Undiagnosed Undiagnosed glucose tolerance glucose tolerance Known diabetes Known diabetes diabetes diabetes Insulin resistance Insulin resistance Insulin resistance Insulin resistance Insulin secretion Insulin secretion Insulin secretion Insulin secretion Postprandial glucose Postprandial glucose Fasting glucose Fasting glucose Fasting glucose Fasting glucose Microvascular complications Microvascular complications Macrovascular complications Macrovascular complications Adapted from Ramlo-Halsted BA, Edelman SV. Prim Care. 1999;26:771-789 Adapted from Ramlo-Halsted BA, Edelman SV. Prim Care. 1999;26:771-789 INSULIN INSULIN RESISTANCE RESISTANCE Insulin resistance Insulin resistance Insulin secretion Insulin secretion Postprandial glucose Fasting glucose Fasting glucose Microvascular complications Macrovascular complications Adapted from Ramlo-Halsted BA, Edelman SV. Prim Care. 1999;26:771-789 1

  2. PRE PRE OVERWEIGHT PATIENT WITH VISCERAL ADIPOSITY DIABETES DIABETES Insulin resistance Insulin resistance Insulin secretion Insulin secretion Postprandial glucose Fasting glucose Fasting glucose Microvascular complications Macrovascular complications Adapted from Ramlo-Halsted BA, Edelman SV. Prim Care. 1999;26:771-789 GLOBAL PROJECTIONS FOR THE DIABESITY GLOBAL PROJECTIONS FOR THE DIABETES EPIDEMIC: 2003- DIABETES EPIDEMIC: 2003 -2025 2025 48.4 58.6 23.0 21% 36.2 82.3 57% 157.4 19.2 91% 39.4 105% 7.1 15.0 111% 14.2 0.85 26.2 1.3 84% 53% World World 2003 = 194 million 2003 = 194 million 2025 = 333 million 2025 = 333 million Increase 72% Increase 72% Mokdad AH et al , JAMA. January 2003;289:76-79 “ “The Thrifty Gene Hypothesis" The Thrifty Gene Hypothesis" Modern Modern Hunter- Hunter -gatherer gatherer society society FAMINE FEAST ENERGY STORAGE FOR OVERLOADED MAXIMUM ADIPOCYTE METABOLIC EFFICIENCY VISCERAL VISCERAL SURVIVAL SURVIVAL OBESITY O BESITY INADEQUACY BETWEEN OUR GENES AND THE ENVIRONMENT 2

  3. THE 10 LEADING COUNTRIES FOR DIABETES PREVALENCE Pima Indians Thrifty Genes Seychelles Kuwait Reunion Singapore Puerto Rico Cuba Bahrain Qatar UAE Nauru 0% 5% 10% 15% 20% 25% 30% 35% CRUDE PREVALENCE %* * for 20-79 year population Jean Vague (1948) Jean Vague (1948) Lower body:gynoid Lower body:gynoid Abdominal:android Abdominal:android Pear-shape Apple-shape METABOLIC DISORDERS The evolving view of adipose tissue: Jean Vague (1948) an endocrine organ Old View: inert storage depot Current View: secretory/endocrine organ Fatty acids Glucose Fed Tg Multiple secretory products Tg Tg Fasted Muscle Fatty acids Glycerol Vasculature Liver Lower body:gynoid Pancreas Abdominal:android Pear-shape Apple-shape CORONARY HEART DISEASE Lyon CJ et al 2003 3

  4. OVERLOADED VISCERAL ADIPOSE TISSUE Adipose Tissue as Endocrine Cells Adipose Tissue as Endocrine Cells BECOMES INSULIN RESISTANT I am Leptin Leptin the culprit Angiotensinogen Angiotensinogen Adiponectin Adiponectin Resistin Resistin Adipocyte Adipocyte PPAR γ TNF TNF- α Plasminogen activator Plasminogen activator inhibitor (PAI inhibitor (PAI-1) 1) IL-6 IL Adipsin (ASP) Adipsin (ASP) Adverse cardiometabolic effects of products of adipocytes OVERLOADED ADIPOCYTE ↓ Lipoprotein lipase Hypertension ↑ Agiotensinogen ↑ IL-6 Inflammation Atherogenic ↑ Insulin These amplifying signals increasingly dyslipidaemia ↑ FFA impair adipocyte insulin signaling and Adipose ↑ TNF α ↑ Resistin eventually cause systemic insulin tissue resistance in liver and muscles ↑ Leptin ↑ Adipsin (Complement D) ↑ Lactate Type 2 TNF α diabetes ↑ Plasminogen IL-6 ↓ Adiponectin activator inhibitor-1 (PAI-1) Atherosclerosis INSULIN Thrombosis RESISTANCE Lyon 2003; Trayhurn et al 2004; Eckel et al 2005 The inflammatory The inflammatory atherosclerotic atherosclerotic process process Inflamm Lumen of markers, blood vessel CRP PLAQUE monocyte RUPTURE sdLDL platelets endothelium MMP-9 sdLDL Inflamm Complex MCP-1 cytokines, fatty streak (vulnerable) chemotaxis IL-6, TNF α plaque Artery wall m φ - differentiation O 2 ROS PAI-1 TL TF ox-LDL Smooth muscle foam cell cells 4

  5. Features of the Metabolic Syndrome Features of the Metabolic Syndrome Liver fat Adiponectin Inflammation Prothrombotic state Insulin resistance CVD Type 2 DM Abdominal obesity Hypertension Dyslipidemia Genetics + lifestyle Genetics β -cell function in the natural history of T2DM Insulin Glucose Resistance Toxicity 100 Lipotoxicity Beta-cell function (%) Age 80 FFA TG 60 Beta Cell Failure IGT 40 Incretin Amylin Effect (IAPP) 20 0 –12 12 –10 –8 –6 –4 –2 0 2 4 6 TNF α Hexosamines Years from diagnosis Other (??) Adapted from UKPDS 16. Diabetes 1995;44:1249–58 Loss of early- Loss of early -phase insulin secretion phase insulin secretion Duration of daily glycaemic Duration of daily glycaemic conditions conditions in type 2 diabetes leads to harmful in type 2 diabetes leads to harmful in non- -diabetics diabetics in non mealtime glucose spikes mealtime glucose spikes Pattern of insulin secretion is altered early in type 2 diabetes Normal Type 2 diabetes 120 120 20 Plasma insulin (µU/ml) Plasma insulin (µU/ml) 20 g glucose Loss of glucose 100 100 early phase 80 80 insulin 60 60 secretion 40 40 Breakfast Lunch Dinner 0:00am 4:00am 20 20 Breakfast 0 0 –30 0 30 60 90 120 –30 0 30 60 90 120 Post-mealtime Post-absorptive Fasting Time (minutes) Time (minutes) Monnier L. Eur J Clin Invest 2000;30(Suppl 2):3–11 Ward WK et al. Diabetes Care 1984;7:491–502 5

  6. Hyperglycemia: the role of oxidative stress? DECODE: risk for all DECODE: risk for all- -cause mortality cause mortality Hyperglycaemia 2.5 Beta-cell 2.0 Hazard ratio 1.5 2-hour plasma glucose Oxidative stress 1.0 ≥ 200 0.5 140–199 (mg/dl) Endothelial dysfunction <140 0.0 <110 110–125 ≥ 126 Fasting plasma glucose (mg/dl) Insulin resistance Adjusted for age, center, sex, cholesterol, body mass index (BMI), Thrombosis systolic blood pressure (SBP), smoking Adapted from DECODE Study Group. Lancet 1999;354:617–21 Endothelium E D H y p e r g l y c a e m i a n y Thrombosis d s o f t u h n Oxidative e c Need for early detection of type 2 Adhesion stress l t molecules diabetes and for a strict control of blood i i a o glucose in diabetic patients in order to l n avoid vascular events Atherosclerosis Breakfast Lunch Dinner Clinical identification Glucose Tolerance Categories of the metabolic syndrome (ATP III) FPG 2-h PPG (OGTT) AT LEAST THREE OF THE FOLLOWING Plasma glucose 240 (mg/dL) Diabetes • Waist circumference 220 Mellitus – Men > 102 cm 200 Diabetes – Women > 88 cm 180 Mellitus IGT • Triglycerides = > 150 mg/dl 160 • HDL-Cholesterol 140 – Men < 40 mg/dl 126 – Women < 50 mg/dl 120 IFG Normal • Blood pressure = >130/ = >85 mm Hg 100 Normal • Fasting glucose = >110 mg/dl 80 60 American Diabetes Association. Diabetes Care. 2004;27(suppl 1):S5-S10 6

  7. Waist circumference is a surrogate Waist circumference is a surrogate Clinical identification of the metabolic syndrome (IDF- April 2005) marker of visceral fat marker of visceral fat VISCERAL OBESITY • Waist circumference (ethnic specific) – Men > 94 cm – Women > 80 cm + Men Women Women Men cm AT LEAST TWO OF THE FOLLOWING >80 cm = Increased risk >94 cm = Increased risk • Triglycerides = > 150 mg/dl • HDL-Cholesterol – Men < 40 mg/dl – Women < 50 mg/dl • Blood pressure = >130/ = >85 mm Hg IDF; 2005 • Fasting glucose = >100 mg/dl WAIST CIRCUMFERENCE - LEBANON NATURAL HISTORY OF IGT NATURAL HISTORY OF IGT Normal Normal < 80 cm 80 - 88 cm < 94 cm 94 -102 cm 33% 33% 32% 26 % 34 % 31% IGT IGT 33% 33% After 10 years After 10 years Diabetes Diabetes > 88 cm > 102 cm 33% 33% 42% 35% IGT IGT MEN (444) WOMEN (415) Can type 2 diabetes be prevented ? Goals behind treating pre-diabetes Insulin Production 100% • Avoiding β β – –cell dysfunction will allow a delayed cell dysfunction will allow a delayed progression from pre diabetes to diabetes progression from pre diabetes to diabetes IR hyperglycemia • Treating individuals at risk of developing 50% diabetes will translate into improved CVD IFG outcomes and mortality rate 20% IGT Insulin O% 10 15 years TRIGGERING Genes & Environement 7

Download Presentation
Download Policy: The content available on the website is offered to you 'AS IS' for your personal information and use only. It cannot be commercialized, licensed, or distributed on other websites without prior consent from the author. To download a presentation, simply click this link. If you encounter any difficulties during the download process, it's possible that the publisher has removed the file from their server.

Recommend


More recommend