
SLIDE 1
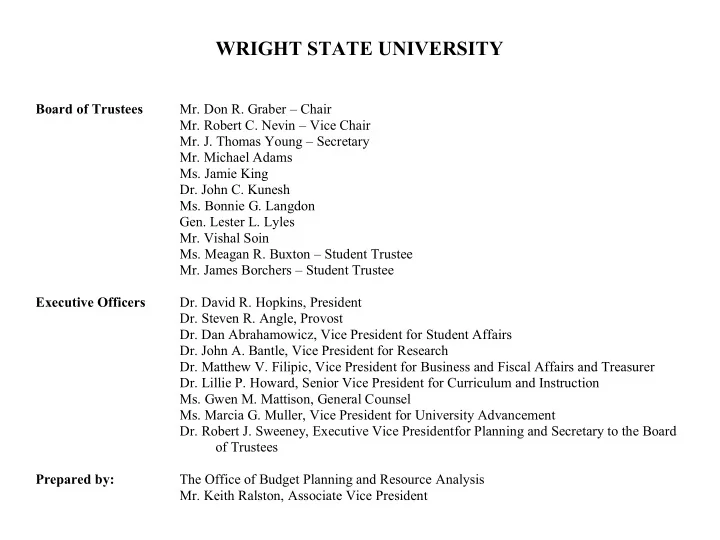
WRIGHT STATE UNIVERSITY
Board of Trustees
- Mr. Don R. Graber – Chair
- Mr. Robert C. Nevin – Vice Chair
- Mr. J. Thomas Young – Secretary
- Mr. Michael Adams
- Ms. Jamie King
- Dr. John C. Kunesh
- Ms. Bonnie G. Langdon
- Gen. Lester L. Lyles
- Mr. Vishal Soin
- Ms. Meagan R. Buxton – Student Trustee
- Mr. James Borchers – Student Trustee
Executive Officers
- Dr. David R. Hopkins, President
- Dr. Steven R. Angle, Provost
- Dr. Dan Abrahamowicz, Vice President for Student Affairs
- Dr. John A. Bantle, Vice President for Research
- Dr. Matthew V. Filipic, Vice President for Business and Fiscal Affairs and Treasurer
- Dr. Lillie P. Howard, Senior Vice President for Curriculum and Instruction
- Ms. Gwen M. Mattison, General Counsel
- Ms. Marcia G. Muller, Vice President for University Advancement
- Dr. Robert J. Sweeney, Executive Vice Presidentfor Planning and Secretary to the Board
- f Trustees
Prepared by: The Office of Budget Planning and Resource Analysis
- Mr. Keith Ralston, Associate Vice President