
SLIDE 1
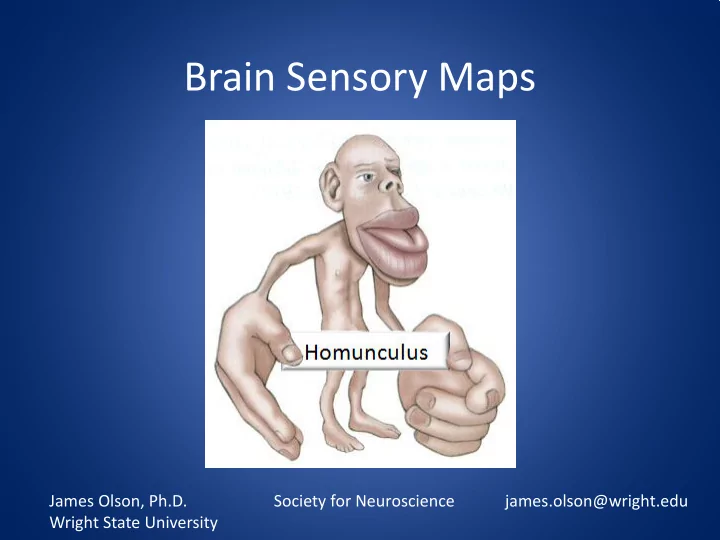
Brain Sensory Maps
James Olson, Ph.D. Society for Neuroscience james.olson@wright.edu Wright State University
Brain Sensory Maps James Olson, Ph.D. Society for Neuroscience - - PowerPoint PPT Presentation
Brain Sensory Maps James Olson, Ph.D. Society for Neuroscience james.olson@wright.edu Wright State University Brain Initiative Announced April 3, 2013 The Human Connectome Project Finding how 100 billion neurons make 100 trillion
James Olson, Ph.D. Society for Neuroscience james.olson@wright.edu Wright State University
The Human Connectome Project Finding how 100 billion neurons make 100 trillion connections. http://www.whitehouse.gov/share/brain-initiative
Neurosurgeon Brain stimulation
Primary somatosensory area Primary visual area Primary auditory area
Motor Areas Sensory Areas
Primary somatosensory area Primary visual area Primary auditory area
Motor Areas Sensory Areas
What is being mapped here? Surface area? What is being mapped here? Surface area? SENSORY RECEPTOR DENSITY
6 cm Single point 1.5 cm 3 cm Also - 0.75 cm and 0.38 cm on a separate card.
Head Foot Leg Hand Torso Arm
The two-point discrimination threshold for each body part is reciprocally related to the size of each corresponding homunculus region.
Body part size (cm) = 10 x (
1 two-point discrimination threshold (cm) )
Body part pictures of various sizes, taped together: 26 cm, 13 cm, 6.7 cm, 1.7 cm
Body parts with more sensory receptors, such as the fingers, map to larger areas of the brain, and should be represented by a larger picture in your personal homunculus.
which contains major lecture points and a detailed description of the homunculus activity.
cutouts and replicate the activity in your classroom. Visit BrainFacts.org to download supplementary workshop materials.
http://www.maxplanckflorida.org/fitzpatricklab/homunculus/