a package for sensory data analysis with r
play

A package for sensory data analysis with R scientific discipline - PowerPoint PPT Presentation

Sensory analysis Sensory Analysis (or Sensory Evaluation) is a A package for sensory data analysis with R scientific discipline that applies principals of experimental design and statistical analysis to the use of human senses (sight, smell,


  1. Sensory analysis • Sensory Analysis (or Sensory Evaluation) is a A package for sensory data analysis with R scientific discipline that applies principals of experimental design and statistical analysis to the use of human senses (sight, smell, taste, touch, hearing) for the purposes of evaluating consumer products.
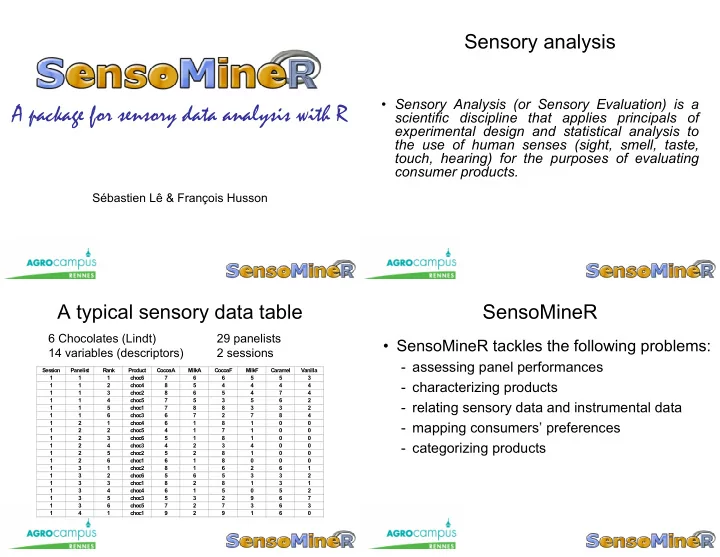
 Sébastien Lê & François Husson A typical sensory data table SensoMineR 6 Chocolates (Lindt) 29 panelists • SensoMineR tackles the following problems: 14 variables (descriptors) 2 sessions - assessing panel performances Ses s ion Panelis t R ank Product C ocoaA M ilkA C ocoaF M ilkF C aram el Vanilla 1 1 1 choc6 7 6 6 5 5 3 - characterizing products 1 1 2 choc4 8 5 4 4 4 4 1 1 3 choc2 8 6 5 4 7 4 1 1 4 choc5 7 5 3 5 6 2 - relating sensory data and instrumental data 1 1 5 choc1 7 8 8 3 3 2 1 1 6 choc3 6 7 2 7 8 4 1 2 1 choc4 6 1 8 1 0 0 - mapping consumers’ preferences 1 2 2 choc5 4 1 7 1 0 0 1 2 3 choc6 5 1 8 1 0 0 - categorizing products 1 2 4 choc3 4 2 3 4 0 0 1 2 5 choc2 5 2 8 1 0 0 1 2 6 choc1 6 1 8 0 0 0 1 3 1 choc2 8 1 6 2 6 1 1 3 2 choc6 5 6 5 3 3 2 1 3 3 choc1 8 2 8 1 3 1 1 3 4 choc4 6 1 5 0 5 2 1 3 5 choc3 5 3 2 9 6 7 1 3 6 choc5 7 2 7 3 6 3 1 4 1 choc1 9 2 9 1 6 0

  2. Analysis of variance model Characterization of products ∀ = μ + α + β + γ + αβ + αγ + βγ + ε Anova with the following model (for CocoaA variable): ( i , j , k ) Y ijk i j k ij ik jk ijk Score = Product + Panelist + Session + Prod:Sess + Prod:Pan + Pan:Sess ε = σ ε ε = ∀ ≠ L ( ) N ( 0 , ) and cov( , ) 0 ( i , j , k ) ( i ' , j ' , k ' ) ijk ijk ' ij ' k ' Df Sum Sq Mean Sq F value Pr(>F) Product 5 207.54 41.51 11.8830 7.752e-13 the general mean where: Panelist 28 390.43 13.94 3.9919 2.552e-08 Session 1 3.72 3.72 1.0662 0.3036 the product effect Prod:Pan 140 322.29 2.30 0.6590 0.9929 Prod:Sess 5 8.14 1.63 0.4659 0.8011 the judge effect Pan:Sess 28 72.11 2.58 0.7373 0.8256 Residuals 140 489.03 3.49 the session effect Coefficients: Estimate Std. Error t value Pr(>|t|) the product:judge interaction effect (Intercept) 6.287356 0.100188 62.756 < 2e-16 Product1 0.798851 0.224026 3.566 0.000497 the product:session interaction effect Product2 0.264368 0.224026 1.180 0.239971 Product3 -1.614943 0.224026 -7.209 3.22e-11 the judge:session interaction effect Product4 -0.028736 0.224026 -0.128 0.898120 Product5 0.505747 0.224026 2.258 0.025522 Characterization of products Characterization of products P-value 4 4 4 MilkF 9.664e-61 choc1 choc2 choc3 3 3 3 CocoaF 1.015e-41 2 2 2 Bitterness 6.529e-41 1 1 1 Df Sum Sq Mean Sq F value Pr(>F) Crunchy 4.817e-37 0 0 0 Product 5 207.54 41.51 11.8830 7.752e-13 Caramel 4.568e-31 -1 -1 -1 Panelist 28 390.43 13.94 3.9919 2.552e-08 -2 -2 -2 Sweetness 1.305e-30 Session 1 3.72 3.72 1.0662 0.3036 Sweetnes Sweetnes Sweetnes -3 -3 -3 Caramel Crunchy Granular Caramel Crunchy Granular CocoaA Caramel Bitterne Astringe Crunchy Granular CocoaA CocoaF Bitterne Astringe CocoaA CocoaF Bitterne Astringe CocoaF Acidity Vanilla Acidity Melting Sticky Vanilla Acidity Melting Sticky Astringency 1.643e-19 Prod:Pan 140 322.29 2.30 0.6590 0.9929 Vanilla Melting Sticky MilkA MilkF MilkA MilkF MilkA MilkF Prod:Sess 5 8.14 1.63 0.4659 0.8011 Melting 1.967e-17 Pan:Sess 28 72.11 2.58 0.7373 0.8256 Acidity 5.669e-15 4 4 4 choc4 choc5 choc6 Residuals 140 489.03 3.49 Vanilla 1.262e-13 3 3 3 2 2 CocoaA 7.752e-13 2 1 1 1 MilkA 1.551e-09 0 0 0 Granular 6.186e-06 -1 -1 -1 Sticky 0.000183 -2 -2 -2 -3 Sweetnes Sweetnes Sweetnes -3 -3 CocoaA Caramel Crunchy Granular CocoaA Caramel Crunchy Granular CocoaA CocoaF Caramel Bitterne Astringe Crunchy Granular CocoaF Bitterne Astringe CocoaF Bitterne Astringe Acidity Melting Vanilla Acidity Melting Sticky Vanilla Acidity Melting Sticky Vanilla Sticky MilkA MilkA MilkF MilkA MilkF MilkF

  3. Characterization of products Characterization of products CocoaA MilkA CocoaF MilkF Caramel Vanilla Sw eetness Acidity BitternessAstringency Crunchy Melting Sticky Granular CocoaA MilkA CocoaF MilkF Caramel Vanilla Sw eetness Acidity BitternessAstringency Crunchy Melting Sticky Granular choc1 7.086 3.586 8.069 1.569 1.672 1.103 3.138 4.655 7.069 4.759 5.966 4.741 3.759 3.448 choc1 7.086 3.586 8.069 1.569 1.672 1.103 3.138 4.655 7.069 4.759 5.966 4.741 3.759 3.448 choc2 6.552 4 6.914 2.379 2.776 1.81 4.621 3.138 4.948 3.155 7.707 4.328 3.828 3.155 choc2 6.552 4 6.914 2.379 2.776 1.81 4.621 3.138 4.948 3.155 7.707 4.328 3.828 3.155 choc3 4.672 6.052 3.379 7.707 6.328 3.672 7.603 1.569 1.397 1.207 2.983 7.31 5.034 1.603 choc3 4.672 6.052 3.379 7.707 6.328 3.672 7.603 1.569 1.397 1.207 2.983 7.31 5.034 1.603 Estimate Std. Error t value Pr(>|t|) choc4 6.259 4.103 6.69 2.586 2.672 2.121 4.293 3.931 5.19 3.69 6.103 4.379 4.103 3.552 choc4 6.259 4.103 6.69 2.586 2.672 2.121 4.293 3.931 5.19 3.69 6.103 4.379 4.103 3.552 Intercept 6.287356 0.100188 62.756 < 2e-16 Product1 0.798851 0.224026 3.566 0.000497 choc5 6.793 4.172 6.793 3.121 3.414 1.793 5.224 3.086 4.879 3.103 6.638 4.741 3.224 3.069 choc5 6.793 4.172 6.793 3.121 3.414 1.793 5.224 3.086 4.879 3.103 6.638 4.741 3.224 3.069 Product2 0.264368 0.224026 1.180 0.239971 Product3 -1.614943 0.224026 -7.209 3.22e-11 Product4 -0.028736 0.224026 -0.128 0.898120 choc6 6.362 4.569 6.224 3.362 3.259 1.914 5.621 2.672 4.19 2.759 7.328 4.207 3.931 3.172 choc6 6.362 4.569 6.224 3.362 3.259 1.914 5.621 2.672 4.19 2.759 7.328 4.207 3.931 3.172 Product5 0.505747 0.224026 2.258 0.025522 Sorting from the PCA graphs Characterization of products choc1 choc1 CocoaA Bitterness CocoaF MilkF MilkA Caramel Vanilla Sweetness Melting Sticky Crunchy Acidity Astringency Granular choc3 choc3 choc4 choc4 choc2 choc2 choc3 7.707 6.052 6.328 3.672 7.603 7.31 5.034 2.983 1.569 1.207 1.603 4.672 1.397 3.379 choc5 choc5 choc6 choc6 choc6 3.362 4.569 3.259 1.914 5.621 4.207 3.931 7.328 2.672 2.759 3.172 6.362 4.19 6.224 Individuals graph Sticky Sticky Acidity Acidity Melting Melting Astringency Astringency choc5 3.121 4.172 3.414 1.793 5.224 4.741 3.224 6.638 3.086 3.103 3.069 6.793 4.879 6.793 Bitterness Bitterness Vanilla Vanilla CocoaF MilkF MilkF MilkA MilkA Granular Granular choc4 2.586 4.103 2.672 2.121 4.293 4.379 4.103 6.103 3.931 3.69 3.552 6.259 5.19 6.69 Caramel Caramel CocoaA CocoaA Sweetness Sweetness choc2 2.379 4 2.776 1.81 4.621 4.328 3.828 7.707 3.138 3.155 3.155 6.552 4.948 6.914 Crunchy Crunchy choc1 1.569 3.586 1.672 1.103 3.138 4.741 3.759 5.966 4.655 4.759 3.448 7.086 7.069 8.069 Variables graph

Download Presentation
Download Policy: The content available on the website is offered to you 'AS IS' for your personal information and use only. It cannot be commercialized, licensed, or distributed on other websites without prior consent from the author. To download a presentation, simply click this link. If you encounter any difficulties during the download process, it's possible that the publisher has removed the file from their server.

Recommend


More recommend